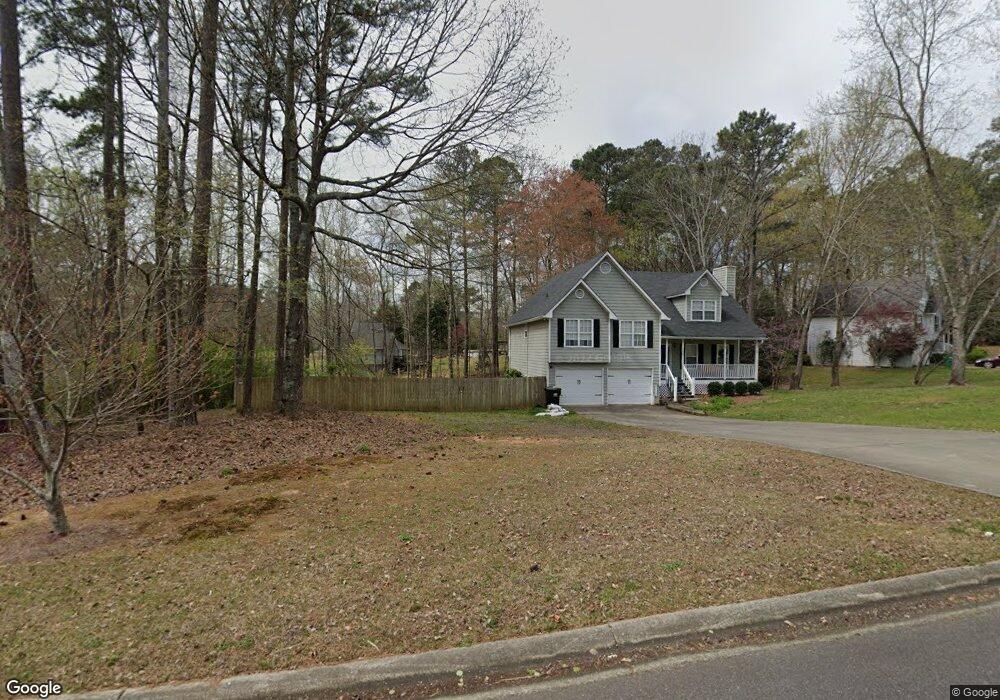
118 Boones Ridge Pkwy SE Unit 3 Acworth, GA 30102
Estimated Value: $383,051 - $404,000
4
Beds
3
Baths
2,412
Sq Ft
$163/Sq Ft
Est. Value
About This Home
This home is located at 118 Boones Ridge Pkwy SE Unit 3, Acworth, GA 30102 and is currently estimated at $392,013, approximately $162 per square foot. 118 Boones Ridge Pkwy SE Unit 3 is a home located in Bartow County with nearby schools including Allatoona Elementary School, Red Top Middle School, and Woodland High School.
Ownership History
Date
Name
Owned For
Owner Type
Purchase Details
Closed on
Oct 5, 2020
Sold by
Deese Joseph Blake
Bought by
Boomer Terry Alexander
Current Estimated Value
Home Financials for this Owner
Home Financials are based on the most recent Mortgage that was taken out on this home.
Original Mortgage
$235,653
Interest Rate
2.9%
Mortgage Type
FHA
Purchase Details
Closed on
May 10, 2018
Sold by
Deese Joseph Blake
Bought by
Deese Joseph Blake and Deese Rachel Ann
Purchase Details
Closed on
May 26, 2010
Sold by
Affordable Housing Assista
Bought by
Deese Joseph Blake
Home Financials for this Owner
Home Financials are based on the most recent Mortgage that was taken out on this home.
Original Mortgage
$116,994
Interest Rate
5%
Mortgage Type
New Conventional
Purchase Details
Closed on
Jun 17, 2005
Sold by
Causey Philip A
Bought by
Mckinney Jerry L and Mckinney Christi
Create a Home Valuation Report for This Property
The Home Valuation Report is an in-depth analysis detailing your home's value as well as a comparison with similar homes in the area
Home Values in the Area
Average Home Value in this Area
Purchase History
| Date | Buyer | Sale Price | Title Company |
|---|---|---|---|
| Boomer Terry Alexander | $240,000 | -- | |
| Boomer Terry Alexander | $240,000 | -- | |
| Deese Joseph Blake | -- | -- | |
| Deese Joseph Blake | $110,400 | -- | |
| Mckinney Jerry L | $162,000 | -- |
Source: Public Records
Mortgage History
| Date | Status | Borrower | Loan Amount |
|---|---|---|---|
| Previous Owner | Boomer Terry Alexander | $235,653 | |
| Previous Owner | Deese Joseph Blake | $116,994 |
Source: Public Records
Tax History Compared to Growth
Tax History
| Year | Tax Paid | Tax Assessment Tax Assessment Total Assessment is a certain percentage of the fair market value that is determined by local assessors to be the total taxable value of land and additions on the property. | Land | Improvement |
|---|---|---|---|---|
| 2024 | $3,599 | $149,664 | $28,000 | $121,664 |
| 2023 | $3,637 | $148,018 | $28,000 | $120,018 |
| 2022 | $3,149 | $124,014 | $28,000 | $96,014 |
| 2021 | $2,354 | $88,242 | $20,000 | $68,242 |
| 2020 | $2,179 | $79,338 | $20,000 | $59,338 |
| 2019 | $2,046 | $73,686 | $20,000 | $53,686 |
| 2018 | $1,870 | $72,135 | $20,000 | $52,135 |
| 2017 | $1,742 | $67,206 | $20,000 | $47,206 |
| 2016 | $1,896 | $72,200 | $14,000 | $58,200 |
| 2015 | $1,675 | $64,280 | $10,000 | $54,280 |
| 2014 | $1,770 | $65,640 | $10,000 | $55,640 |
| 2013 | -- | $57,600 | $10,000 | $47,600 |
Source: Public Records
Map
Nearby Homes
- 10 Mariner Way SE
- 135 Boones Ridge Pkwy SE
- 0 Jacobs Rd SE Unit 7534888
- 144 Boones Ridge Pkwy SE
- 5900 Jacobs Rd
- 5767 James Rd
- 25 Boones Ridge Pkwy SE
- 3720 James Rd
- 6168 Emerald Springs Way SE
- 4079 Arrington Rd SE
- 3487 Kellogg Creek Rd
- 2279 Highway 92
- 4160 Hall St SE
- 3500 Twin Pines Dr
- 0 E Emerald Oaks Dr Unit 10591658
- 3332 Hunt Rd
- 3375 Spinnaker Way
- 118 Boones Ridge Pkwy SE
- 114 Boones Ridge Pkwy SE
- 12 Mariner Way SE
- 117 Boones Ridge Pkwy SE
- 119 Boones Ridge Pkwy SE
- 115 Boones Ridge Pkwy SE
- 121 Boones Ridge Pkwy SE
- 14 Mariner Way SE
- 113 Boones Ridge Pkwy SE
- 123 Boones Ridge Pkwy SE
- 15 Mariner Way SE
- 11 Mariner Way SE
- 11 Mariner Way SE
- 111 Boones Ridge Pkwy SE
- 106 Boones Ridge Pkwy SE
- 16 Mariner Way SE
- 109 Boones Ridge Pkwy SE
- 0 Mariner Way Unit 8686782
- 0 Mariner Way Unit 3239318
- 0 Mariner Way Unit 7395039