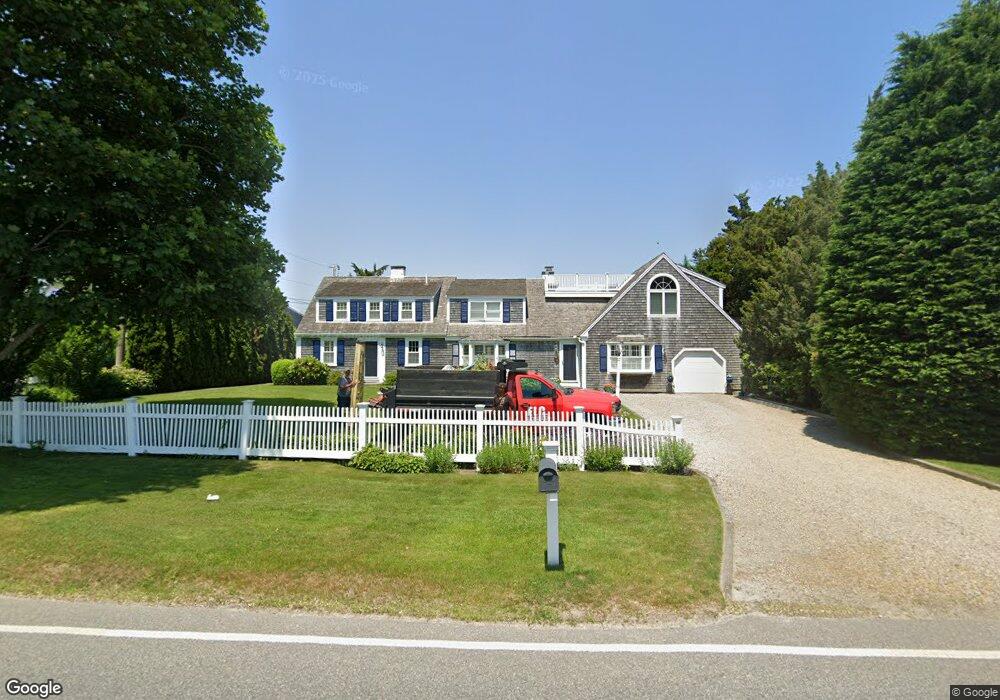
118 Bridge St Osterville, MA 02655
Osterville NeighborhoodEstimated Value: $2,257,241 - $2,902,000
4
Beds
5
Baths
2,446
Sq Ft
$1,060/Sq Ft
Est. Value
About This Home
This home is located at 118 Bridge St, Osterville, MA 02655 and is currently estimated at $2,592,560, approximately $1,059 per square foot. 118 Bridge St is a home located in Barnstable County with nearby schools including West Villages Elementary School, Barnstable United Elementary School, and Barnstable Intermediate School.
Ownership History
Date
Name
Owned For
Owner Type
Purchase Details
Closed on
Jun 30, 2005
Sold by
Buck N Harrison and Buck Nancy B
Bought by
Moran Anne T
Current Estimated Value
Home Financials for this Owner
Home Financials are based on the most recent Mortgage that was taken out on this home.
Original Mortgage
$700,000
Outstanding Balance
$367,059
Interest Rate
5.73%
Mortgage Type
Purchase Money Mortgage
Estimated Equity
$2,225,501
Purchase Details
Closed on
Nov 10, 1993
Sold by
Barletta Vicki M
Bought by
Buck N Harrison
Purchase Details
Closed on
Jan 15, 1991
Sold by
Crosby Chester A and Crosby Katrina
Bought by
Barletta Vicki
Create a Home Valuation Report for This Property
The Home Valuation Report is an in-depth analysis detailing your home's value as well as a comparison with similar homes in the area
Home Values in the Area
Average Home Value in this Area
Purchase History
| Date | Buyer | Sale Price | Title Company |
|---|---|---|---|
| Moran Anne T | $1,275,000 | -- | |
| Buck N Harrison | $395,000 | -- | |
| Barletta Vicki | $266,000 | -- |
Source: Public Records
Mortgage History
| Date | Status | Borrower | Loan Amount |
|---|---|---|---|
| Open | Barletta Vicki | $417,000 | |
| Open | Moran Anne T | $700,000 |
Source: Public Records
Tax History
| Year | Tax Paid | Tax Assessment Tax Assessment Total Assessment is a certain percentage of the fair market value that is determined by local assessors to be the total taxable value of land and additions on the property. | Land | Improvement |
|---|---|---|---|---|
| 2025 | $14,772 | $1,825,900 | $1,062,400 | $763,500 |
| 2024 | $13,536 | $1,733,200 | $1,062,400 | $670,800 |
| 2023 | $12,108 | $1,451,800 | $857,000 | $594,800 |
| 2022 | $12,099 | $1,255,100 | $755,700 | $499,400 |
| 2021 | $1,882 | $1,181,600 | $755,700 | $425,900 |
| 2020 | $1,891 | $1,156,700 | $755,700 | $401,000 |
| 2019 | $12,564 | $1,113,800 | $755,700 | $358,100 |
| 2018 | $1,746 | $1,058,600 | $753,100 | $305,500 |
| 2017 | $11,238 | $1,044,400 | $753,100 | $291,300 |
| 2016 | $13,990 | $1,283,500 | $1,067,500 | $216,000 |
| 2015 | $13,594 | $1,252,900 | $1,027,600 | $225,300 |
Source: Public Records
Map
Nearby Homes
- 405 Bridge St
- 33 Sunset Ln
- 67 Fire Station Rd
- 168 Garrison Ln
- 920 Main St Unit 1 Building 2
- 920 Main St Unit 2-1
- 146 Scudder Rd
- 39 Blossom Ave Unit 4
- 39 Tower Hill Rd Unit 1C
- 414 Eel River Rd
- 25 Oyster Way
- 30 Pond St
- 29 Oak Ridge Rd
- 123 Tower Hill Rd
- 71 Sand Point
- 501 Eel River Rd
- 51 Wianno Cir
- 98 Bunker Hill Rd
- 850 Sea View Ave
- 14 Indian Trail