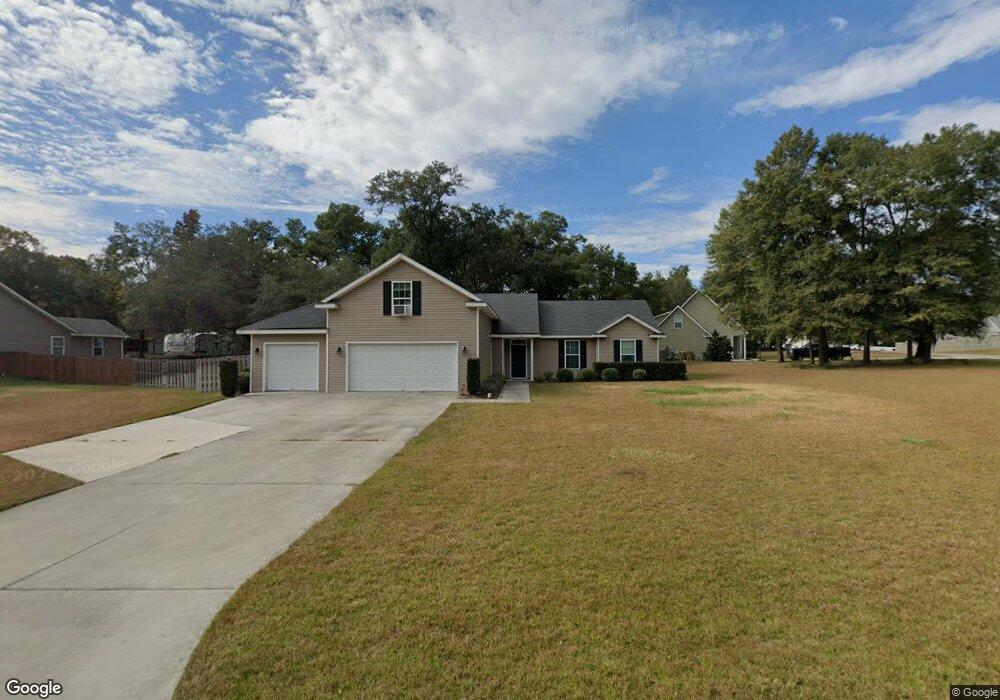
118 Buford Hill Rd Eden, GA 31307
Estimated Value: $398,000 - $417,000
3
Beds
2
Baths
2,345
Sq Ft
$174/Sq Ft
Est. Value
About This Home
This home is located at 118 Buford Hill Rd, Eden, GA 31307 and is currently estimated at $408,093, approximately $174 per square foot. 118 Buford Hill Rd is a home with nearby schools including Sand Hill Elementary School, South Effingham Middle School, and South Effingham High School.
Ownership History
Date
Name
Owned For
Owner Type
Purchase Details
Closed on
May 16, 2023
Sold by
Moore Cody
Bought by
Ckm Investments Llc
Current Estimated Value
Purchase Details
Closed on
Mar 31, 2017
Sold by
Skidaway Investments Llc
Bought by
Moore Cody and Moore Kourtney
Home Financials for this Owner
Home Financials are based on the most recent Mortgage that was taken out on this home.
Original Mortgage
$196,813
Interest Rate
4.1%
Mortgage Type
New Conventional
Purchase Details
Closed on
Feb 26, 2016
Sold by
Bgn Investments Llc
Bought by
Skidaway Investments Llc
Purchase Details
Closed on
Feb 27, 2015
Sold by
Amby Development Inc
Bought by
Bgn Investments Llc
Purchase Details
Closed on
Nov 24, 2014
Sold by
Morris Dennis C and Morris Kimberle J
Bought by
Amby Development Inc
Purchase Details
Closed on
Jun 13, 2011
Sold by
Edwards Ronald Wayne
Bought by
Heritagebank Of The South
Purchase Details
Closed on
Feb 20, 2002
Bought by
Edwards Ronald Wayne
Create a Home Valuation Report for This Property
The Home Valuation Report is an in-depth analysis detailing your home's value as well as a comparison with similar homes in the area
Home Values in the Area
Average Home Value in this Area
Purchase History
| Date | Buyer | Sale Price | Title Company |
|---|---|---|---|
| Ckm Investments Llc | -- | -- | |
| Moore Cody | $202,900 | -- | |
| Skidaway Investments Llc | $25,500 | -- | |
| Bgn Investments Llc | $380,000 | -- | |
| Amby Development Inc | $161,500 | -- | |
| Heritagebank Of The South | $252,500 | -- | |
| Edwards Ronald Wayne | $215,000 | -- |
Source: Public Records
Mortgage History
| Date | Status | Borrower | Loan Amount |
|---|---|---|---|
| Previous Owner | Moore Cody | $196,813 |
Source: Public Records
Tax History Compared to Growth
Tax History
| Year | Tax Paid | Tax Assessment Tax Assessment Total Assessment is a certain percentage of the fair market value that is determined by local assessors to be the total taxable value of land and additions on the property. | Land | Improvement |
|---|---|---|---|---|
| 2024 | $4,062 | $135,502 | $22,800 | $112,702 |
| 2023 | $3,433 | $136,907 | $17,600 | $119,307 |
| 2022 | $4,186 | $134,107 | $14,800 | $119,307 |
| 2021 | $3,290 | $101,980 | $14,000 | $87,980 |
| 2020 | $2,647 | $100,346 | $12,000 | $88,346 |
| 2019 | $2,662 | $92,263 | $11,600 | $80,663 |
| 2018 | $2,625 | $86,535 | $11,600 | $74,935 |
| 2017 | $2,967 | $88,877 | $10,200 | $78,677 |
| 2016 | $229 | $8,000 | $8,000 | $0 |
| 2015 | -- | $6,400 | $6,400 | $0 |
Source: Public Records
Map
Nearby Homes
- 101 Shimmering Dell Dr
- 218 Ridge Rd
- 175 Kings Way
- 203 Cypress Lakes Dr
- 141 Otter Way
- 227 Pebblestone Dr
- 223 Pebblestone Dr
- 100 Sandstone Dr
- 12010 Highway 280 E
- 0 Sand Hill Rd Unit 22392317
- 0 Sand Hill Rd Unit 325134
- 114 Carriage House Dr
- 128 Watson Mill Rd
- 123 Watson Mill Rd
- 130 Watson Mill Rd
- 140 Watson Mill Rd
- 136 Watson Mill Rd
- 134 Watson Mill Rd
- 127 Watson Mill Rd
- 142 Watson Mill Rd
- 100 Buford Hill Rd
- 102 Buford Hill Rd
- 107 Buford Hill Rd
- 104 Buford Hill Rd
- 120 Buford Hill Rd
- 103 Buford
- 101 Buford
- 117 Buford Hill Rd
- 120 Buford Hill Rd
- 118 Buford Hill Rd
- 107 Buford Hill Rd
- 110 & 128 Buford Hill Rd
- 117 Buford Hill Rd
- 100 Buford Hill Rd
- 102 Buford Hill Rd
- 104 Buford Hill Rd
- 101 Buford Hill Rd
- 462 E Us Highway 80
- 108 Shimmering Dell Dr
- 110 Shimmering Dell Dr