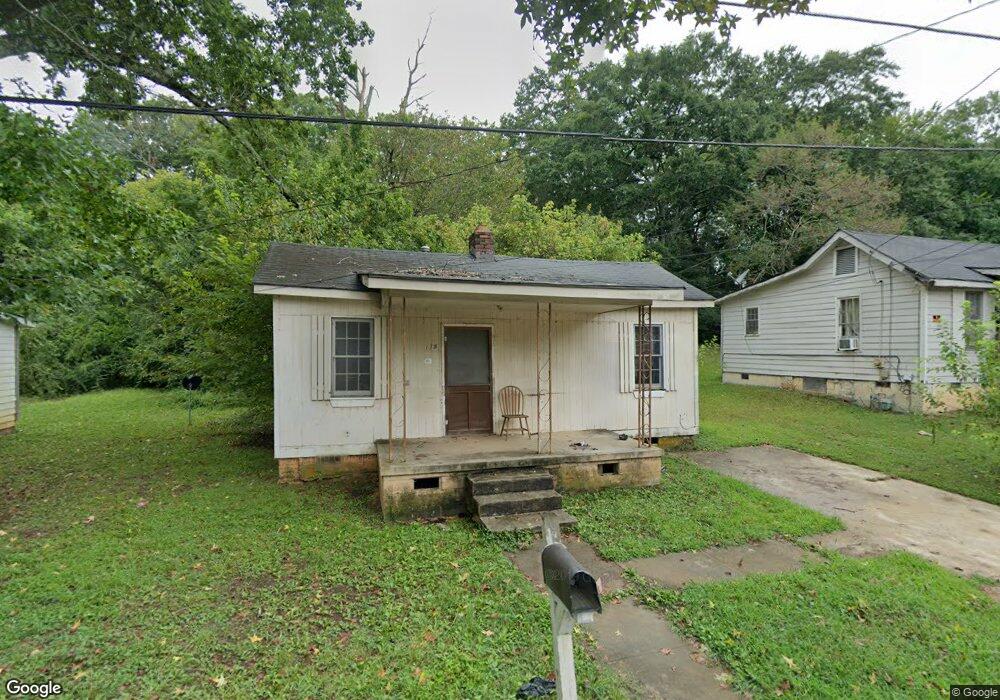
118 Burr St Lagrange, GA 30241
Estimated Value: $56,411 - $86,000
2
Beds
1
Bath
672
Sq Ft
$101/Sq Ft
Est. Value
About This Home
This home is located at 118 Burr St, Lagrange, GA 30241 and is currently estimated at $68,103, approximately $101 per square foot. 118 Burr St is a home located in Troup County with nearby schools including Hollis Hand Elementary School, Franklin Forest Elementary School, and Ethel W. Kight Elementary School.
Ownership History
Date
Name
Owned For
Owner Type
Purchase Details
Closed on
Nov 25, 2025
Sold by
Plex Lgb Llc
Bought by
Plex De Motion Lg Llc
Current Estimated Value
Home Financials for this Owner
Home Financials are based on the most recent Mortgage that was taken out on this home.
Original Mortgage
$794,500
Outstanding Balance
$783,162
Interest Rate
6.17%
Mortgage Type
Construction
Estimated Equity
-$715,059
Purchase Details
Closed on
Sep 1, 1970
Sold by
Hadaway Martha Cleaveland
Bought by
Mallory Realty Co Inc
Purchase Details
Closed on
May 1, 1930
Sold by
Hadaway Dr and Hadaway W
Bought by
Hadaway Martha Cleaveland
Create a Home Valuation Report for This Property
The Home Valuation Report is an in-depth analysis detailing your home's value as well as a comparison with similar homes in the area
Purchase History
| Date | Buyer | Sale Price | Title Company |
|---|---|---|---|
| Plex De Motion Lg Llc | -- | -- | |
| Mallory Realty Co Inc | -- | -- | |
| Hadaway Martha Cleaveland | -- | -- |
Source: Public Records
Mortgage History
| Date | Status | Borrower | Loan Amount |
|---|---|---|---|
| Open | Plex De Motion Lg Llc | $794,500 |
Source: Public Records
Tax History
| Year | Tax Paid | Tax Assessment Tax Assessment Total Assessment is a certain percentage of the fair market value that is determined by local assessors to be the total taxable value of land and additions on the property. | Land | Improvement |
|---|---|---|---|---|
| 2025 | $296 | $10,840 | $2,400 | $8,440 |
| 2024 | $191 | $7,000 | $2,400 | $4,600 |
| 2023 | $184 | $6,760 | $2,400 | $4,360 |
| 2022 | $182 | $6,520 | $2,400 | $4,120 |
| 2021 | $162 | $5,360 | $2,160 | $3,200 |
| 2020 | $168 | $5,360 | $2,160 | $3,200 |
| 2019 | $124 | $4,120 | $1,720 | $2,400 |
| 2018 | $124 | $4,120 | $1,720 | $2,400 |
| 2017 | $124 | $4,120 | $1,720 | $2,400 |
| 2016 | $117 | $3,879 | $1,620 | $2,259 |
| 2015 | $117 | $3,879 | $1,620 | $2,259 |
| 2014 | $117 | $3,879 | $1,620 | $2,259 |
| 2013 | -- | $5,088 | $2,160 | $2,928 |
Source: Public Records
Map
Nearby Homes
Your Personal Tour Guide
Ask me questions while you tour the home.