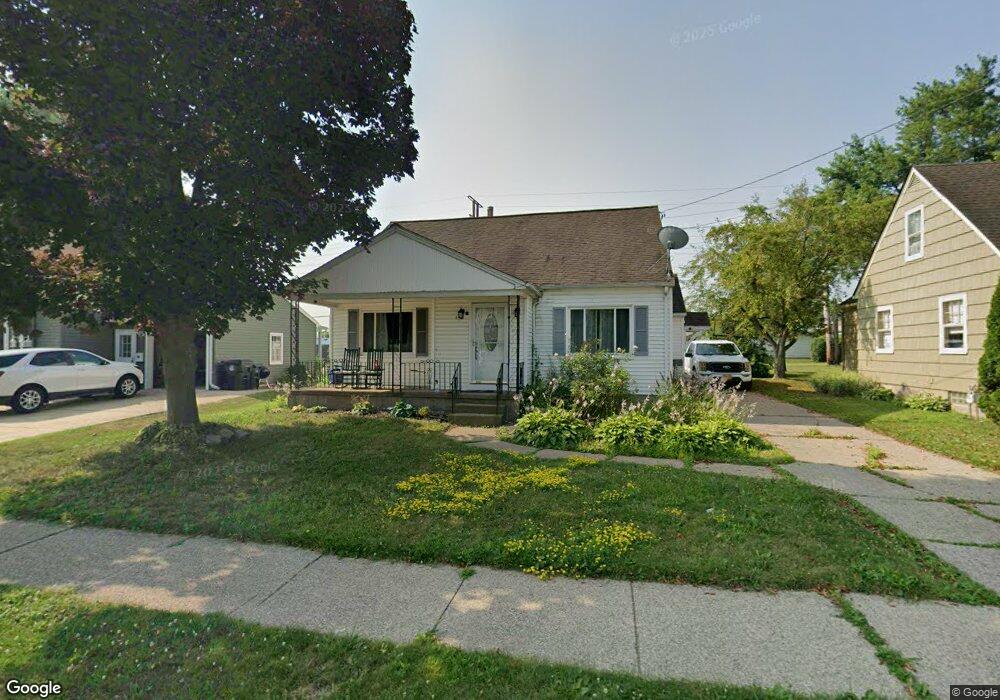
118 Canton St Tonawanda, NY 14150
Estimated Value: $227,000 - $269,000
3
Beds
2
Baths
1,208
Sq Ft
$203/Sq Ft
Est. Value
About This Home
This home is located at 118 Canton St, Tonawanda, NY 14150 and is currently estimated at $245,722, approximately $203 per square foot. 118 Canton St is a home located in Erie County with nearby schools including Mullen Elementary School, Tonawanda Elementary School, and Tonawanda Middle High School.
Ownership History
Date
Name
Owned For
Owner Type
Purchase Details
Closed on
May 20, 2005
Sold by
Dolpp Mark B and Dolpp Dawn M
Bought by
Johnston Andrew L and Johnston Jacqualyn A
Current Estimated Value
Home Financials for this Owner
Home Financials are based on the most recent Mortgage that was taken out on this home.
Original Mortgage
$112,365
Outstanding Balance
$58,550
Interest Rate
5.83%
Mortgage Type
VA
Estimated Equity
$187,172
Purchase Details
Closed on
Sep 10, 1997
Create a Home Valuation Report for This Property
The Home Valuation Report is an in-depth analysis detailing your home's value as well as a comparison with similar homes in the area
Home Values in the Area
Average Home Value in this Area
Purchase History
| Date | Buyer | Sale Price | Title Company |
|---|---|---|---|
| Johnston Andrew L | $110,000 | -- | |
| -- | $74,000 | -- |
Source: Public Records
Mortgage History
| Date | Status | Borrower | Loan Amount |
|---|---|---|---|
| Open | Johnston Andrew L | $112,365 |
Source: Public Records
Tax History Compared to Growth
Tax History
| Year | Tax Paid | Tax Assessment Tax Assessment Total Assessment is a certain percentage of the fair market value that is determined by local assessors to be the total taxable value of land and additions on the property. | Land | Improvement |
|---|---|---|---|---|
| 2024 | $2,344 | $166,000 | $14,800 | $151,200 |
| 2023 | $1,731 | $166,000 | $14,800 | $151,200 |
| 2022 | $2,696 | $128,000 | $16,000 | $112,000 |
| 2021 | $2,686 | $128,000 | $16,000 | $112,000 |
| 2020 | $2,016 | $128,000 | $16,000 | $112,000 |
| 2019 | $4,525 | $128,000 | $16,000 | $112,000 |
| 2018 | $1,929 | $128,000 | $16,000 | $112,000 |
| 2017 | $672 | $111,000 | $15,700 | $95,300 |
| 2016 | $2,087 | $111,000 | $15,700 | $95,300 |
| 2015 | -- | $111,000 | $15,700 | $95,300 |
| 2014 | -- | $111,000 | $15,700 | $95,300 |
Source: Public Records
Map
Nearby Homes