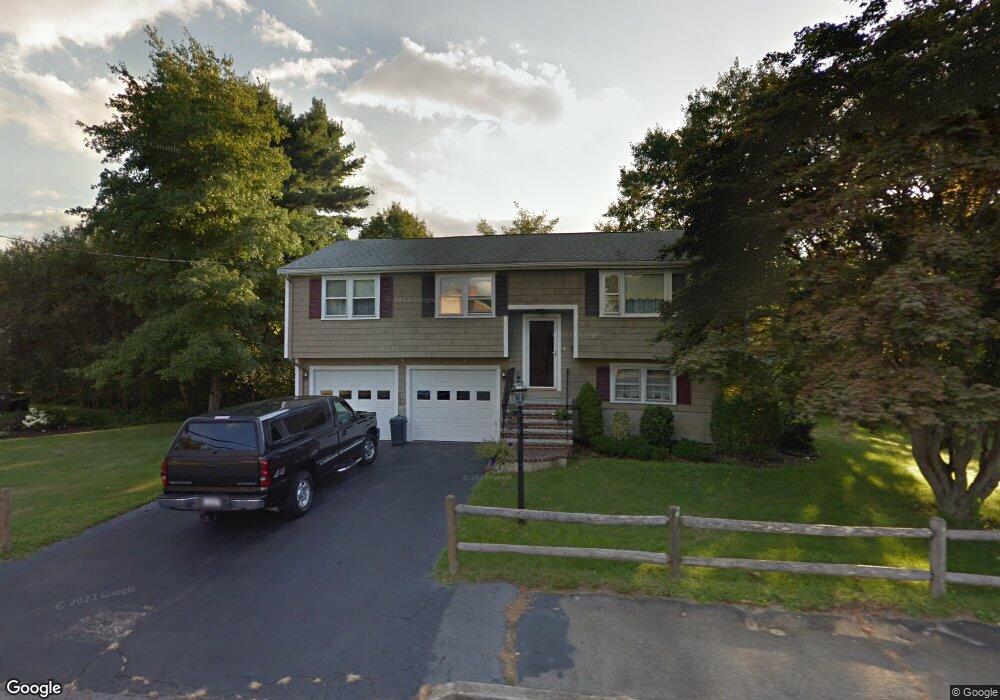
118 Carolyn Rd South Weymouth, MA 02190
South Weymouth NeighborhoodEstimated Value: $683,220 - $701,000
3
Beds
3
Baths
1,240
Sq Ft
$555/Sq Ft
Est. Value
About This Home
This home is located at 118 Carolyn Rd, South Weymouth, MA 02190 and is currently estimated at $688,805, approximately $555 per square foot. 118 Carolyn Rd is a home located in Norfolk County with nearby schools including Thomas V Nash, Abigail Adams Middle School, and Weymouth Middle School Chapman.
Ownership History
Date
Name
Owned For
Owner Type
Purchase Details
Closed on
Jun 29, 2021
Sold by
Maki John R
Bought by
Barry Michael J and Puopolo April J
Current Estimated Value
Home Financials for this Owner
Home Financials are based on the most recent Mortgage that was taken out on this home.
Original Mortgage
$480,000
Outstanding Balance
$435,526
Interest Rate
2.9%
Mortgage Type
Purchase Money Mortgage
Estimated Equity
$253,279
Create a Home Valuation Report for This Property
The Home Valuation Report is an in-depth analysis detailing your home's value as well as a comparison with similar homes in the area
Home Values in the Area
Average Home Value in this Area
Purchase History
| Date | Buyer | Sale Price | Title Company |
|---|---|---|---|
| Barry Michael J | $570,000 | None Available |
Source: Public Records
Mortgage History
| Date | Status | Borrower | Loan Amount |
|---|---|---|---|
| Open | Barry Michael J | $480,000 |
Source: Public Records
Tax History Compared to Growth
Tax History
| Year | Tax Paid | Tax Assessment Tax Assessment Total Assessment is a certain percentage of the fair market value that is determined by local assessors to be the total taxable value of land and additions on the property. | Land | Improvement |
|---|---|---|---|---|
| 2025 | $6,023 | $596,300 | $243,000 | $353,300 |
| 2024 | $5,887 | $573,200 | $231,400 | $341,800 |
| 2023 | $5,525 | $528,700 | $214,300 | $314,400 |
| 2022 | $5,293 | $461,900 | $198,400 | $263,500 |
| 2021 | $4,997 | $425,600 | $198,400 | $227,200 |
| 2020 | $4,859 | $407,600 | $198,400 | $209,200 |
| 2019 | $4,740 | $391,100 | $190,800 | $200,300 |
| 2018 | $4,689 | $375,100 | $189,300 | $185,800 |
| 2017 | $4,387 | $342,500 | $180,300 | $162,200 |
| 2016 | $4,282 | $334,500 | $173,400 | $161,100 |
| 2015 | $4,159 | $322,400 | $173,400 | $149,000 |
| 2014 | $4,013 | $301,700 | $161,300 | $140,400 |
Source: Public Records
Map
Nearby Homes
- 2 Mitchell Ln Unit B
- 92 Mercury St
- 27 Park Ave
- 24 Fisher Rd
- 16 Jay Rd
- 308 Forest St
- 262 West St
- 255 West St
- 68 Massapoag St Unit 7
- 120 Randolph St
- 261 Pleasant St Unit 3
- 261 Pleasant St Unit 5
- 45 Union St
- 193 Randolph St
- 120 Burkhall St Unit K
- 211 Randolph St
- 50 Hollis St
- 116 Belmont St
- 110 Burkhall St Unit H
- 18 Fountain Ln Unit 2