Estimated Value: $189,000 - $248,000
3
Beds
2
Baths
1,337
Sq Ft
$160/Sq Ft
Est. Value
About This Home
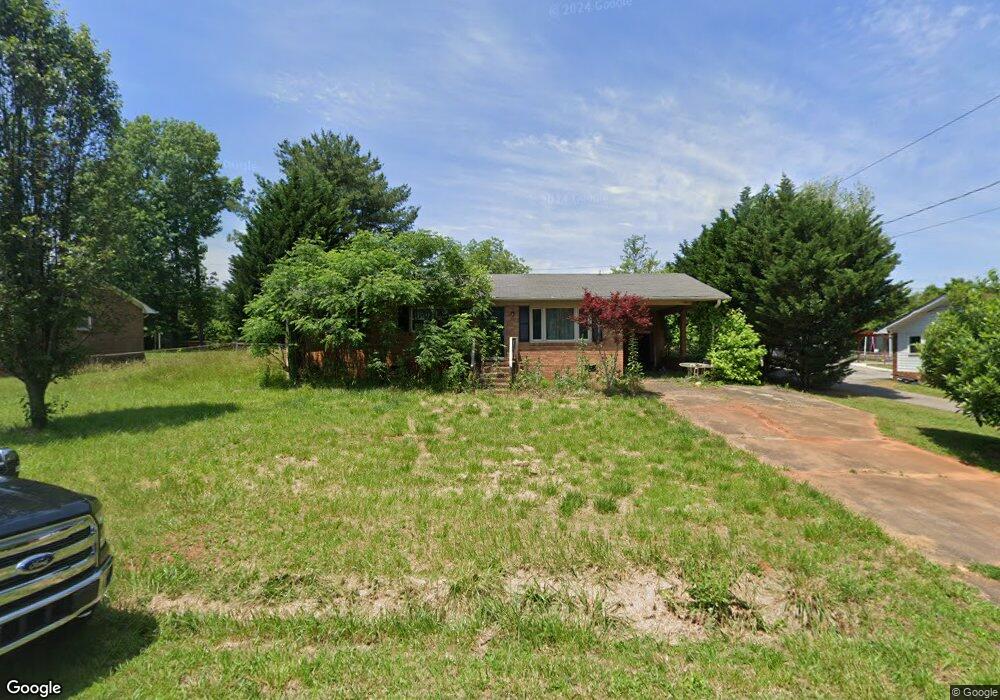
This home is located at 118 Center St, Inman, SC 29349 and is currently estimated at $213,396, approximately $159 per square foot. 118 Center St is a home located in Spartanburg County with nearby schools including Oakland Elementary School, Boiling Springs Middle School, and Boiling Springs High School.
Ownership History
Date
Name
Owned For
Owner Type
Purchase Details
Closed on
Nov 1, 2016
Sold by
Yegorshin Aleksey
Bought by
Mullinax Janine
Current Estimated Value
Home Financials for this Owner
Home Financials are based on the most recent Mortgage that was taken out on this home.
Original Mortgage
$115,296
Outstanding Balance
$95,986
Interest Rate
3.5%
Mortgage Type
Purchase Money Mortgage
Estimated Equity
$117,410
Purchase Details
Closed on
Nov 23, 2015
Sold by
Cooper Master Gordon G and Ford Jayson
Bought by
Yegorshin Aleksey
Purchase Details
Closed on
Mar 31, 2006
Sold by
Gregory Roger M
Bought by
Ford Jayson
Home Financials for this Owner
Home Financials are based on the most recent Mortgage that was taken out on this home.
Original Mortgage
$82,500
Interest Rate
6.2%
Mortgage Type
New Conventional
Purchase Details
Closed on
Feb 2, 2004
Sold by
Gregory Roger M
Bought by
Gregory Roger M
Create a Home Valuation Report for This Property
The Home Valuation Report is an in-depth analysis detailing your home's value as well as a comparison with similar homes in the area
Home Values in the Area
Average Home Value in this Area
Purchase History
| Date | Buyer | Sale Price | Title Company |
|---|---|---|---|
| Mullinax Janine | $115,296 | None Available | |
| Yegorshin Aleksey | $45,000 | None Available | |
| Ford Jayson | $82,500 | Hanover Title Agency | |
| Gregory Roger M | -- | -- |
Source: Public Records
Mortgage History
| Date | Status | Borrower | Loan Amount |
|---|---|---|---|
| Open | Mullinax Janine | $115,296 | |
| Previous Owner | Ford Jayson | $82,500 |
Source: Public Records
Tax History Compared to Growth
Tax History
| Year | Tax Paid | Tax Assessment Tax Assessment Total Assessment is a certain percentage of the fair market value that is determined by local assessors to be the total taxable value of land and additions on the property. | Land | Improvement |
|---|---|---|---|---|
| 2025 | $2,807 | $7,948 | $1,171 | $6,777 |
| 2024 | $2,807 | $7,948 | $1,171 | $6,777 |
| 2023 | $2,807 | $7,948 | $1,171 | $6,777 |
| 2022 | $2,548 | $6,912 | $900 | $6,012 |
| 2021 | $470 | $4,608 | $600 | $4,008 |
| 2020 | $459 | $4,608 | $600 | $4,008 |
| 2019 | $459 | $4,608 | $600 | $4,008 |
| 2018 | $449 | $4,608 | $600 | $4,008 |
| 2017 | $449 | $6,900 | $900 | $6,000 |
| 2016 | $2,027 | $5,634 | $900 | $4,734 |
| 2015 | $629 | $3,756 | $600 | $3,156 |
| 2014 | $619 | $3,756 | $600 | $3,156 |
Source: Public Records
Map
Nearby Homes
- 124 Venus St
- 243 Rainbow Cir
- 119 Bell Ave
- 125 Bell Ave
- 521 Signal Hill Ln
- 517 Signal Hill Ln
- 130 Bell Ave
- 415 Abernathy Rd
- 00 Wynette Way
- 201 Old Burnett Rd
- 407 Hickory Nut Dr
- 568 Quail Creek Rd
- 131 Lockman St
- 190 Dean Ave
- 1620 Rainbow Lake Rd
- 7088 Fairview Falls Dr
- 7097 Fairview Falls Dr
- 7089 Fairview Falls Dr
- 7070 Fairview Falls Dr
- 7077 Fairview Falls Dr