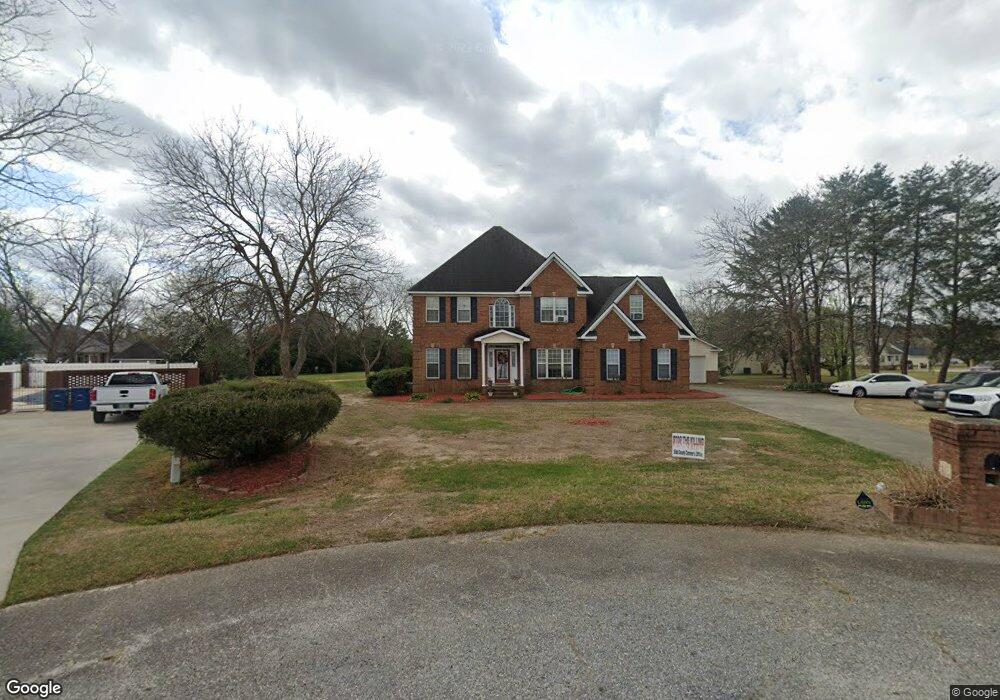
118 Chad Ct Macon, GA 31216
Estimated Value: $364,000 - $411,000
4
Beds
4
Baths
2,837
Sq Ft
$135/Sq Ft
Est. Value
About This Home
This home is located at 118 Chad Ct, Macon, GA 31216 and is currently estimated at $382,562, approximately $134 per square foot. 118 Chad Ct is a home located in Bibb County with nearby schools including Porter Elementary School, Rutland Middle School, and Rutland High School.
Ownership History
Date
Name
Owned For
Owner Type
Purchase Details
Closed on
Jan 25, 2024
Sold by
Burden Cayla S
Bought by
Jones Sheila S
Current Estimated Value
Purchase Details
Closed on
Apr 4, 2022
Sold by
Heon Jones Marion
Bought by
Burden Cayla S
Purchase Details
Closed on
Nov 22, 1996
Sold by
Pecan Acres Inc By William F Hudson
Bought by
Jones Marion Leon and Jones Sheila S
Create a Home Valuation Report for This Property
The Home Valuation Report is an in-depth analysis detailing your home's value as well as a comparison with similar homes in the area
Home Values in the Area
Average Home Value in this Area
Purchase History
| Date | Buyer | Sale Price | Title Company |
|---|---|---|---|
| Jones Sheila S | -- | None Listed On Document | |
| Burden Cayla S | -- | None Listed On Document | |
| Jones Marion Leon | $23,000 | -- |
Source: Public Records
Tax History Compared to Growth
Tax History
| Year | Tax Paid | Tax Assessment Tax Assessment Total Assessment is a certain percentage of the fair market value that is determined by local assessors to be the total taxable value of land and additions on the property. | Land | Improvement |
|---|---|---|---|---|
| 2025 | $3,607 | $146,763 | $12,000 | $134,763 |
| 2024 | $3,754 | $147,796 | $12,000 | $135,796 |
| 2023 | $4,048 | $136,654 | $10,000 | $126,654 |
| 2022 | $3,987 | $122,155 | $10,000 | $112,155 |
| 2021 | $3,486 | $98,726 | $10,000 | $88,726 |
| 2020 | $3,561 | $98,726 | $10,000 | $88,726 |
| 2019 | $3,481 | $95,912 | $10,000 | $85,912 |
| 2018 | $5,473 | $95,289 | $10,000 | $85,289 |
| 2017 | $3,308 | $95,289 | $10,000 | $85,289 |
| 2016 | $3,055 | $95,289 | $10,000 | $85,289 |
| 2015 | $4,324 | $95,289 | $10,000 | $85,289 |
| 2014 | $4,102 | $90,627 | $10,000 | $80,627 |
Source: Public Records
Map
Nearby Homes