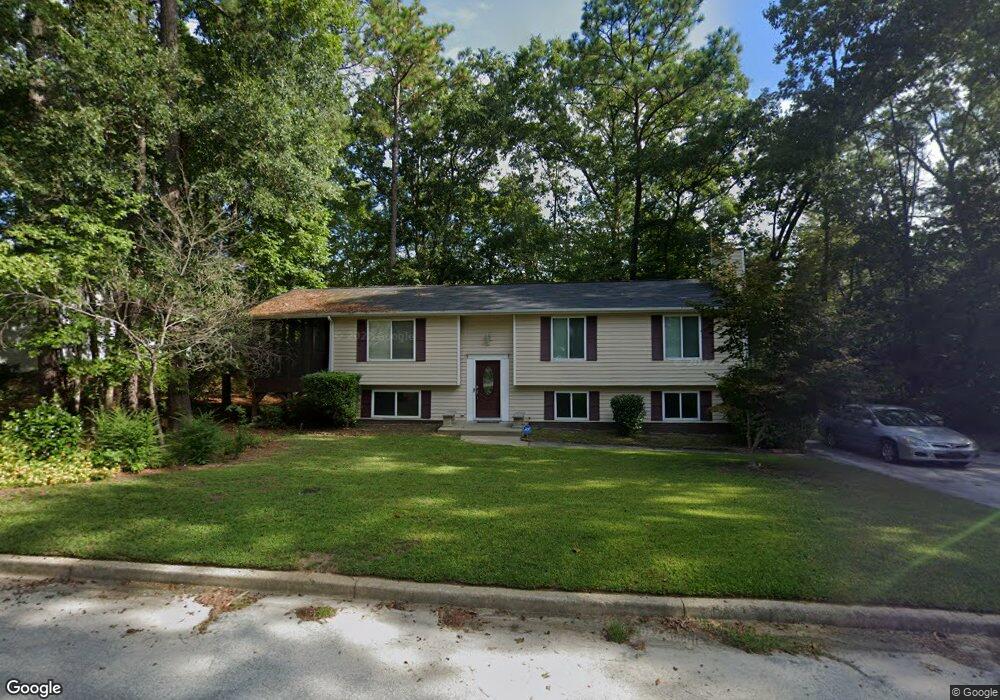
118 Chinquapin Cir Columbia, SC 29212
Saint Andrews NeighborhoodEstimated Value: $302,727 - $329,000
5
Beds
3
Baths
2,390
Sq Ft
$133/Sq Ft
Est. Value
About This Home
This home is located at 118 Chinquapin Cir, Columbia, SC 29212 and is currently estimated at $318,432, approximately $133 per square foot. 118 Chinquapin Cir is a home located in Richland County with nearby schools including Pine Grove Elementary School, St. Andrews Middle School, and Columbia High School.
Ownership History
Date
Name
Owned For
Owner Type
Purchase Details
Closed on
Jun 24, 2021
Sold by
Martin Joseph T
Bought by
Campbell Frankie L and Campbell Michele M
Current Estimated Value
Home Financials for this Owner
Home Financials are based on the most recent Mortgage that was taken out on this home.
Original Mortgage
$230,743
Outstanding Balance
$208,909
Interest Rate
2.9%
Mortgage Type
FHA
Estimated Equity
$109,523
Purchase Details
Closed on
May 2, 2018
Sold by
Clark Alan David
Bought by
Martin Joseph T
Home Financials for this Owner
Home Financials are based on the most recent Mortgage that was taken out on this home.
Original Mortgage
$159,953
Interest Rate
4.45%
Mortgage Type
New Conventional
Purchase Details
Closed on
Jun 12, 2009
Sold by
Smith Mary Carolyn
Bought by
Clark Alan David
Create a Home Valuation Report for This Property
The Home Valuation Report is an in-depth analysis detailing your home's value as well as a comparison with similar homes in the area
Home Values in the Area
Average Home Value in this Area
Purchase History
| Date | Buyer | Sale Price | Title Company |
|---|---|---|---|
| Campbell Frankie L | $235,000 | None Available | |
| Martin Joseph T | $164,900 | None Available | |
| Clark Alan David | -- | -- |
Source: Public Records
Mortgage History
| Date | Status | Borrower | Loan Amount |
|---|---|---|---|
| Open | Campbell Frankie L | $230,743 | |
| Previous Owner | Martin Joseph T | $159,953 |
Source: Public Records
Tax History Compared to Growth
Tax History
| Year | Tax Paid | Tax Assessment Tax Assessment Total Assessment is a certain percentage of the fair market value that is determined by local assessors to be the total taxable value of land and additions on the property. | Land | Improvement |
|---|---|---|---|---|
| 2024 | $2,091 | $235,900 | $22,000 | $213,900 |
| 2023 | $2,010 | $8,600 | $0 | $0 |
| 2022 | $5,908 | $215,000 | $20,000 | $195,000 |
| 2021 | $1,478 | $6,600 | $0 | $0 |
| 2020 | $1,542 | $6,600 | $0 | $0 |
| 2019 | $1,520 | $6,600 | $0 | $0 |
| 2018 | $1,092 | $5,070 | $0 | $0 |
| 2017 | $1,067 | $5,070 | $0 | $0 |
| 2016 | $1,062 | $5,070 | $0 | $0 |
| 2015 | $1,067 | $5,070 | $0 | $0 |
| 2014 | $1,065 | $126,700 | $0 | $0 |
| 2013 | -- | $5,070 | $0 | $0 |
Source: Public Records
Map
Nearby Homes
- 135 Winding Chestnut Dr
- 137 Winding Chestnut Dr
- 145 Winding Chestnut Dr
- 125 Winding Chestnut Dr
- 122 Winding Chestnut Dr
- 119 Winding Chestnut Dr
- 134 Winding Chestnut Dr
- 124 Winding Chestnut Dr
- 18 Southpine Ct
- 45 Battery Walk Ct Unit B
- Earle Plan at Piney Woods Bluff
- 5 Tawny Branch Ct
- 338 Ryegrass Way
- 9 Tawny Branch Ct
- 340 Ryegrass Way
- 110 Prairie Grass Way
- 121 Prairie Grass Way
- 117 Prairie Grass Way
- 108 Prairie Grass Way
- 112 Prairie Grass Way
- 160 Chinquapin Cir
- 122 Chinquapin Cir
- 152 Chinquapin Cir
- 164 Chinquapin Cir
- 113 Chinquapin Cir
- 117 Chinquapin Cir
- 132 Chinquapin Cir
- 108 Chinquapin Cir
- 146 Chinquapin Cir
- 109 Chinquapin Cir
- 121 Chinquapin Cir
- 168 Chinquapin Cir
- 157 Chinquapin Cir
- 161 Chinquapin Cir
- 145 Shadowpine Rd
- 141 Shadowpine Rd
- 153 Chinquapin Cir
- 105 Chinquapin Cir
- 125 Chinquapin Cir
- 165 Chinquapin Cir