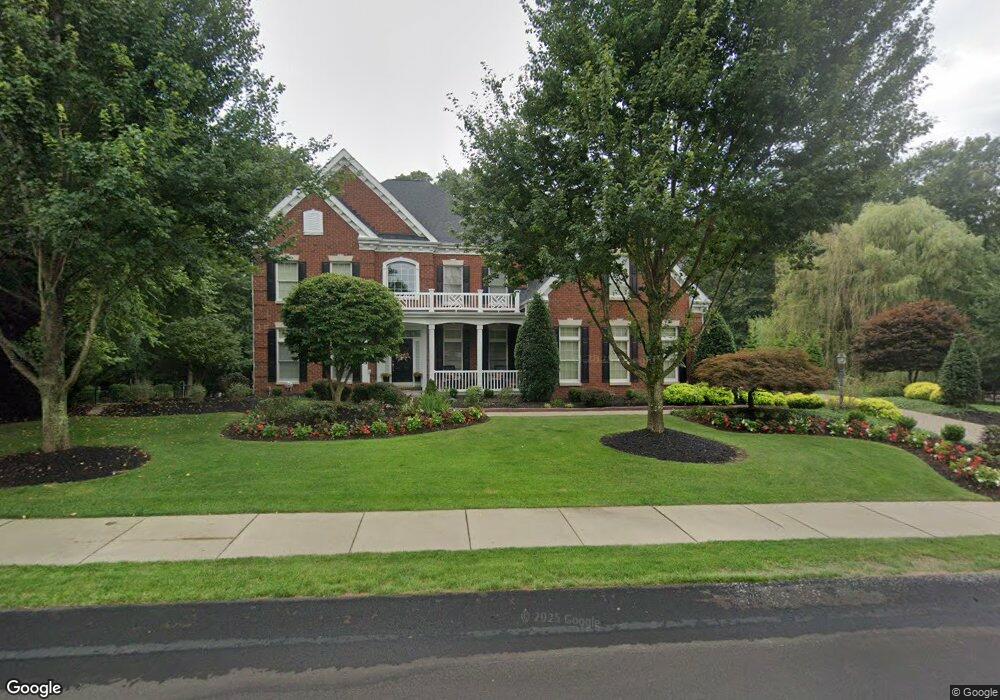
118 Clover Ln Gibsonia, PA 15044
Pine Township NeighborhoodEstimated Value: $1,249,000 - $1,466,000
4
Beds
5
Baths
6,614
Sq Ft
$207/Sq Ft
Est. Value
About This Home
This home is located at 118 Clover Ln, Gibsonia, PA 15044 and is currently estimated at $1,366,711, approximately $206 per square foot. 118 Clover Ln is a home located in Allegheny County with nearby schools including Eden Hall Upper Elementary, Richland Elementary School, and Pine-Richland Middle School.
Ownership History
Date
Name
Owned For
Owner Type
Purchase Details
Closed on
Apr 13, 2016
Sold by
Bigler Joseph A
Bought by
Bigler Joseph A and Bigler Kristin E
Current Estimated Value
Purchase Details
Closed on
Dec 29, 2010
Sold by
Omega Moos L L C
Bought by
Bigler Joseph A
Home Financials for this Owner
Home Financials are based on the most recent Mortgage that was taken out on this home.
Original Mortgage
$576,000
Outstanding Balance
$384,919
Interest Rate
4.37%
Mortgage Type
New Conventional
Estimated Equity
$981,792
Purchase Details
Closed on
May 16, 2008
Sold by
Heartland Homes Inc
Bought by
Omega Moos L L C
Create a Home Valuation Report for This Property
The Home Valuation Report is an in-depth analysis detailing your home's value as well as a comparison with similar homes in the area
Home Values in the Area
Average Home Value in this Area
Purchase History
| Date | Buyer | Sale Price | Title Company |
|---|---|---|---|
| Bigler Joseph A | -- | Attorney | |
| Bigler Joseph A | $720,000 | -- | |
| Omega Moos L L C | $600,000 | -- |
Source: Public Records
Mortgage History
| Date | Status | Borrower | Loan Amount |
|---|---|---|---|
| Open | Bigler Joseph A | $576,000 |
Source: Public Records
Tax History Compared to Growth
Tax History
| Year | Tax Paid | Tax Assessment Tax Assessment Total Assessment is a certain percentage of the fair market value that is determined by local assessors to be the total taxable value of land and additions on the property. | Land | Improvement |
|---|---|---|---|---|
| 2025 | $16,966 | $670,200 | $82,300 | $587,900 |
| 2024 | $16,966 | $670,200 | $82,300 | $587,900 |
| 2023 | $16,966 | $670,200 | $82,300 | $587,900 |
| 2022 | $16,219 | $670,200 | $82,300 | $587,900 |
| 2021 | $16,210 | $640,700 | $82,300 | $558,400 |
| 2020 | $16,219 | $640,700 | $82,300 | $558,400 |
| 2019 | $16,219 | $640,700 | $82,300 | $558,400 |
| 2018 | $3,031 | $640,700 | $82,300 | $558,400 |
| 2017 | $15,977 | $640,700 | $82,300 | $558,400 |
| 2016 | $3,031 | $640,700 | $82,300 | $558,400 |
| 2015 | $3,031 | $640,700 | $82,300 | $558,400 |
| 2014 | $15,979 | $640,700 | $82,300 | $558,400 |
Source: Public Records
Map
Nearby Homes
- 120 Timothy Rd
- 4108 Spruce Rd
- 2013 Cherry Rd
- 131 Birch Dr
- 2015 Cherry Rd
- 9002 Hickory Rd
- 9007 Hickory Rd
- 690 Pearce Mill Rd
- (Lot 133) 310 Mccutcheon Ct
- 300 Mccutcheon Ct
- (Lot 115) 557 Macleod Dr
- (Lot 323) 214 Macfadden Dr
- 0 Old State Rd
- 503 Cambridge Ct
- 223 Fox Meadow Dr
- 1804 Appleridge Ct
- 115 Lyndhurst Cir
- 124 Fox Meadow Dr
- 212 Scotch Pine Ct
- 5003 Old Orchard Ln