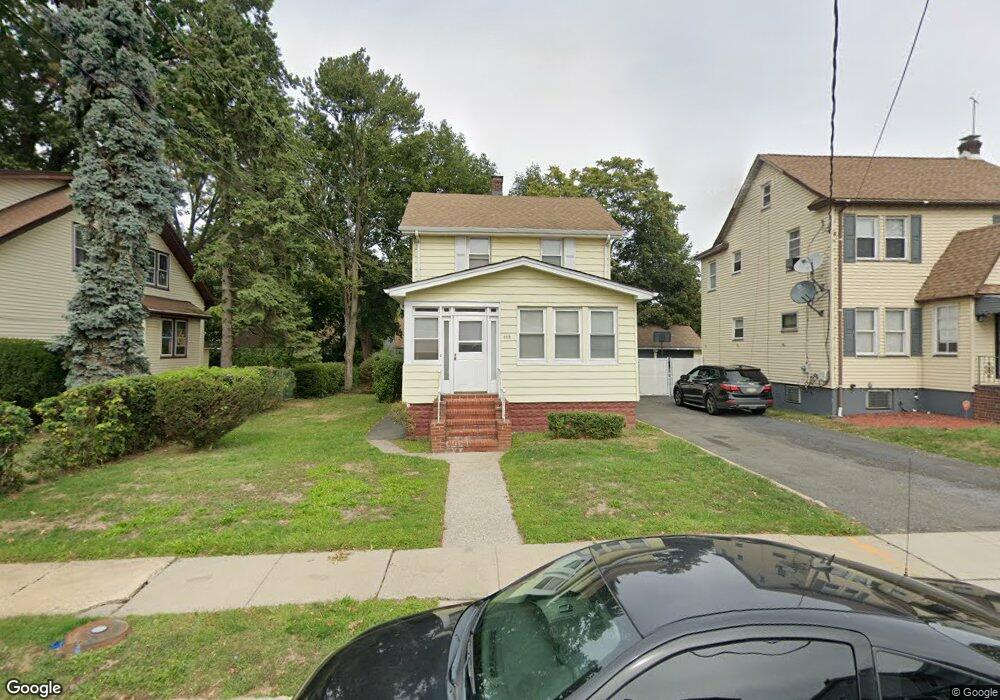
118 Crane St Roselle, NJ 07203
Estimated Value: $337,000 - $446,000
Studio
--
Bath
919
Sq Ft
$411/Sq Ft
Est. Value
About This Home
This home is located at 118 Crane St, Roselle, NJ 07203 and is currently estimated at $377,757, approximately $411 per square foot. 118 Crane St is a home located in Union County with nearby schools including Dr Charles C Polk School, Leonard V. Moore Middle School, and Grace Wilday Junior High School.
Ownership History
Date
Name
Owned For
Owner Type
Purchase Details
Closed on
Aug 26, 2021
Sold by
Paden Claudette
Bought by
Paden Jamilla
Current Estimated Value
Home Financials for this Owner
Home Financials are based on the most recent Mortgage that was taken out on this home.
Original Mortgage
$110,890
Outstanding Balance
$100,902
Interest Rate
2.8%
Mortgage Type
New Conventional
Estimated Equity
$276,855
Create a Home Valuation Report for This Property
The Home Valuation Report is an in-depth analysis detailing your home's value as well as a comparison with similar homes in the area
Home Values in the Area
Average Home Value in this Area
Purchase History
| Date | Buyer | Sale Price | Title Company |
|---|---|---|---|
| Paden Jamilla | $220,000 | Investment Title Llc | |
| Paden Jamilla | $220,000 | Investment Title |
Source: Public Records
Mortgage History
| Date | Status | Borrower | Loan Amount |
|---|---|---|---|
| Open | Paden Jamilla | $110,890 | |
| Closed | Paden Jamilla | $110,890 |
Source: Public Records
Tax History
| Year | Tax Paid | Tax Assessment Tax Assessment Total Assessment is a certain percentage of the fair market value that is determined by local assessors to be the total taxable value of land and additions on the property. | Land | Improvement |
|---|---|---|---|---|
| 2025 | $9,078 | $104,400 | $62,000 | $42,400 |
| 2024 | $8,850 | $104,400 | $62,000 | $42,400 |
| 2023 | $8,850 | $104,400 | $62,000 | $42,400 |
| 2022 | $8,912 | $104,400 | $62,000 | $42,400 |
| 2021 | $8,858 | $104,400 | $62,000 | $42,400 |
| 2020 | $8,830 | $104,400 | $62,000 | $42,400 |
| 2019 | $8,717 | $104,400 | $62,000 | $42,400 |
| 2018 | $8,669 | $104,400 | $62,000 | $42,400 |
| 2017 | $8,623 | $104,400 | $62,000 | $42,400 |
| 2016 | $8,433 | $104,400 | $62,000 | $42,400 |
| 2015 | $8,432 | $104,400 | $62,000 | $42,400 |
| 2014 | $8,197 | $104,400 | $62,000 | $42,400 |
Source: Public Records
Map
Nearby Homes
Your Personal Tour Guide
Ask me questions while you tour the home.