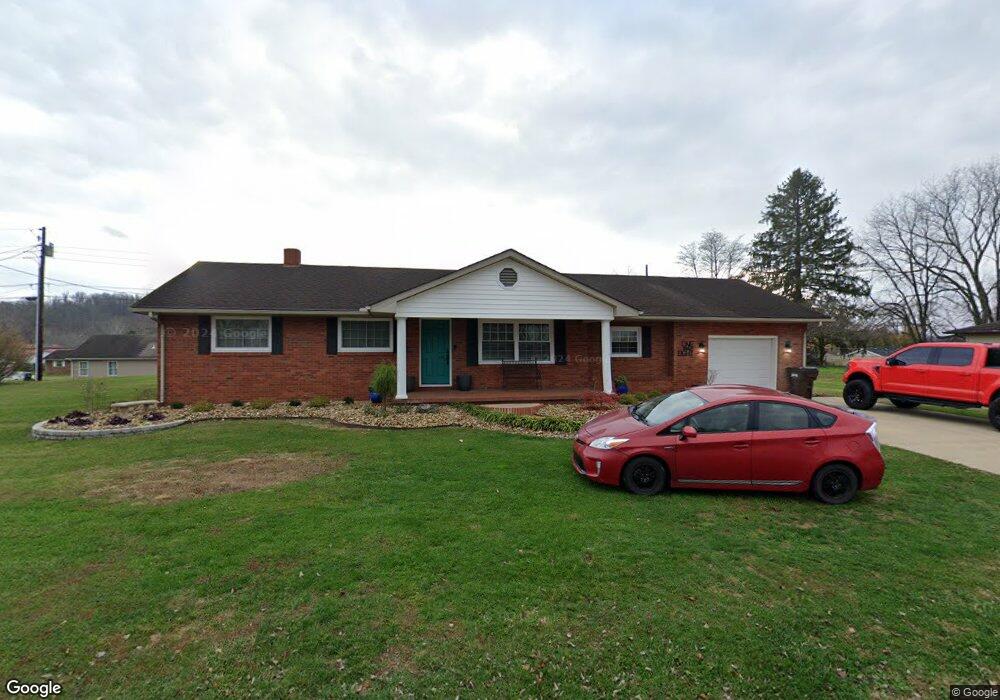
118 Doris Ln South Shore, KY 41175
Estimated Value: $170,000 - $266,000
3
Beds
2
Baths
1,872
Sq Ft
$111/Sq Ft
Est. Value
About This Home
This home is located at 118 Doris Ln, South Shore, KY 41175 and is currently estimated at $206,932, approximately $110 per square foot. 118 Doris Ln is a home located in Greenup County with nearby schools including Greenup County High School.
Ownership History
Date
Name
Owned For
Owner Type
Purchase Details
Closed on
Jun 7, 2014
Sold by
David W David W and Everman Ann
Bought by
Everman David W and Everman Ann
Current Estimated Value
Purchase Details
Closed on
Oct 29, 2010
Sold by
Bodner George and Bodner Betty
Bought by
Everman David W
Home Financials for this Owner
Home Financials are based on the most recent Mortgage that was taken out on this home.
Original Mortgage
$140,000
Interest Rate
4.37%
Mortgage Type
VA
Create a Home Valuation Report for This Property
The Home Valuation Report is an in-depth analysis detailing your home's value as well as a comparison with similar homes in the area
Home Values in the Area
Average Home Value in this Area
Purchase History
| Date | Buyer | Sale Price | Title Company |
|---|---|---|---|
| Everman David W | -- | Rainbow Title Company Inc | |
| Everman David W | $140,000 | Bestitle Agency Inc |
Source: Public Records
Mortgage History
| Date | Status | Borrower | Loan Amount |
|---|---|---|---|
| Previous Owner | Everman David W | $140,000 |
Source: Public Records
Tax History Compared to Growth
Tax History
| Year | Tax Paid | Tax Assessment Tax Assessment Total Assessment is a certain percentage of the fair market value that is determined by local assessors to be the total taxable value of land and additions on the property. | Land | Improvement |
|---|---|---|---|---|
| 2025 | $2,386 | $140,000 | $20,000 | $120,000 |
| 2024 | $2,381 | $140,000 | $20,000 | $120,000 |
| 2023 | $2,247 | $140,000 | $20,000 | $120,000 |
| 2022 | $2,178 | $140,000 | $20,000 | $120,000 |
| 2021 | $2,169 | $140,000 | $20,000 | $120,000 |
| 2020 | $2,134 | $140,000 | $20,000 | $120,000 |
| 2019 | $2,154 | $140,000 | $20,000 | $120,000 |
| 2018 | $2,206 | $140,000 | $20,000 | $120,000 |
| 2017 | $2,123 | $140,000 | $20,000 | $120,000 |
| 2016 | $2,123 | $140,000 | $20,000 | $120,000 |
| 2015 | $2,107 | $140,000 | $20,000 | $120,000 |
| 2014 | $2,089 | $140,000 | $20,000 | $120,000 |
| 2011 | -- | $140,000 | $20,000 | $120,000 |
Source: Public Records
Map
Nearby Homes