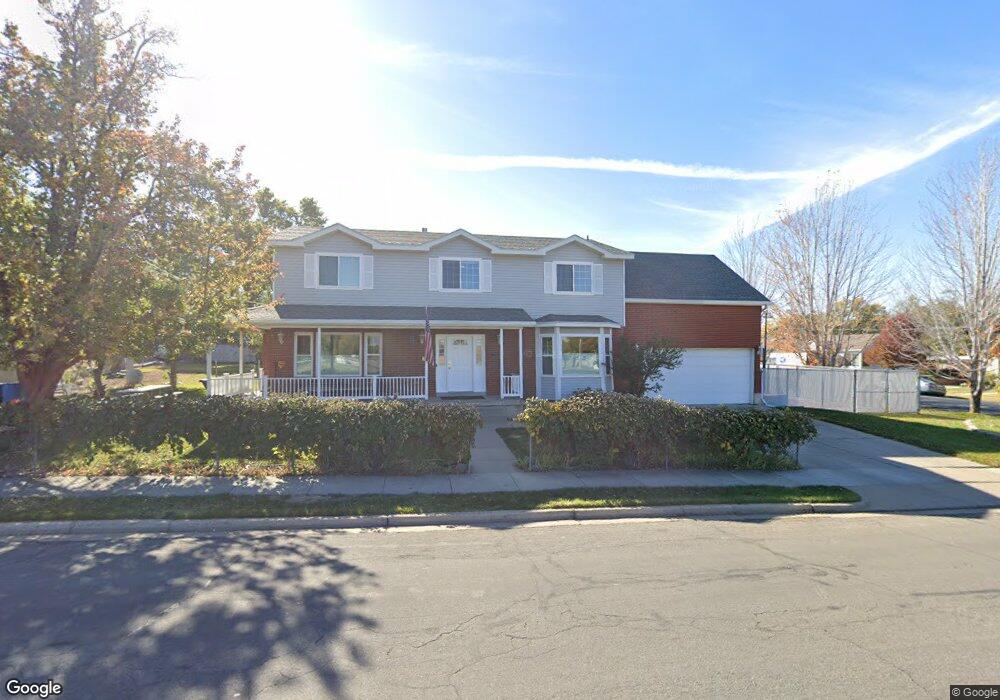
118 E 1000 S Bountiful, UT 84010
Estimated Value: $664,000 - $740,000
4
Beds
3
Baths
3,074
Sq Ft
$231/Sq Ft
Est. Value
About This Home
This home is located at 118 E 1000 S, Bountiful, UT 84010 and is currently estimated at $708,636, approximately $230 per square foot. 118 E 1000 S is a home located in Davis County with nearby schools including Bountiful Elementary School, Millcreek Junior High School, and Bountiful High School.
Ownership History
Date
Name
Owned For
Owner Type
Purchase Details
Closed on
Feb 17, 2021
Sold by
Crawford James L and Crawford Carol Jean
Bought by
Crawford James and Crawford Carol Jean
Current Estimated Value
Home Financials for this Owner
Home Financials are based on the most recent Mortgage that was taken out on this home.
Original Mortgage
$100,000
Interest Rate
2.65%
Mortgage Type
Credit Line Revolving
Purchase Details
Closed on
Mar 22, 2013
Sold by
Crawford James L and Crawford Carol Jean
Bought by
Crawford James L and Smith Crawford Carol Jean
Home Financials for this Owner
Home Financials are based on the most recent Mortgage that was taken out on this home.
Original Mortgage
$288,000
Interest Rate
3.49%
Mortgage Type
New Conventional
Purchase Details
Closed on
Nov 13, 2007
Sold by
Crawford James Lee and Crawford Carol Jean
Bought by
Crawford James L and Crawford Carol Jean Smith
Create a Home Valuation Report for This Property
The Home Valuation Report is an in-depth analysis detailing your home's value as well as a comparison with similar homes in the area
Purchase History
| Date | Buyer | Sale Price | Title Company |
|---|---|---|---|
| Crawford James | -- | Inwest Title Service | |
| Crawford James L | -- | Cornerstone Title Ins | |
| Crawford James L | -- | Cornerstone Title Ins | |
| Crawford James L | -- | None Available |
Source: Public Records
Mortgage History
| Date | Status | Borrower | Loan Amount |
|---|---|---|---|
| Closed | Crawford James | $100,000 | |
| Closed | Crawford James L | $288,000 |
Source: Public Records
Tax History
| Year | Tax Paid | Tax Assessment Tax Assessment Total Assessment is a certain percentage of the fair market value that is determined by local assessors to be the total taxable value of land and additions on the property. | Land | Improvement |
|---|---|---|---|---|
| 2025 | $3,845 | $349,800 | $140,872 | $208,928 |
| 2024 | $3,582 | $336,600 | $130,737 | $205,863 |
| 2023 | $3,563 | $609,000 | $235,982 | $373,018 |
| 2022 | $3,731 | $350,350 | $127,654 | $222,696 |
| 2021 | $3,234 | $464,000 | $167,255 | $296,745 |
| 2020 | $2,858 | $411,000 | $141,134 | $269,866 |
| 2019 | $2,869 | $403,000 | $137,742 | $265,258 |
| 2018 | $2,719 | $376,000 | $134,772 | $241,228 |
| 2016 | $2,402 | $180,180 | $59,217 | $120,963 |
| 2015 | $2,315 | $163,735 | $59,217 | $104,518 |
| 2014 | $2,264 | $164,651 | $59,217 | $105,434 |
| 2013 | -- | $181,621 | $45,396 | $136,225 |
Source: Public Records
Map
Nearby Homes
- 545 S 100 E
- 323 Peach Ln
- 650 S Main St Unit 7107
- 650 S Main St Unit 6206
- 650 S Main St Unit 4104
- 650 S Main St Unit 9106
- 275 E Peach Ln S
- 380 E 1500 S
- 141 E 1650 S
- 255 E 400 S
- 456 E 500 S
- 357 S 100 E
- 34 W 400 S
- 32 W 400 S
- 1350 S 200 W
- 1314 S 200 W Unit 19
- 1820 S 50 W
- 1016 S 400 W
- 190 W 1800 S
- 631 E 1700 S
Your Personal Tour Guide
Ask me questions while you tour the home.