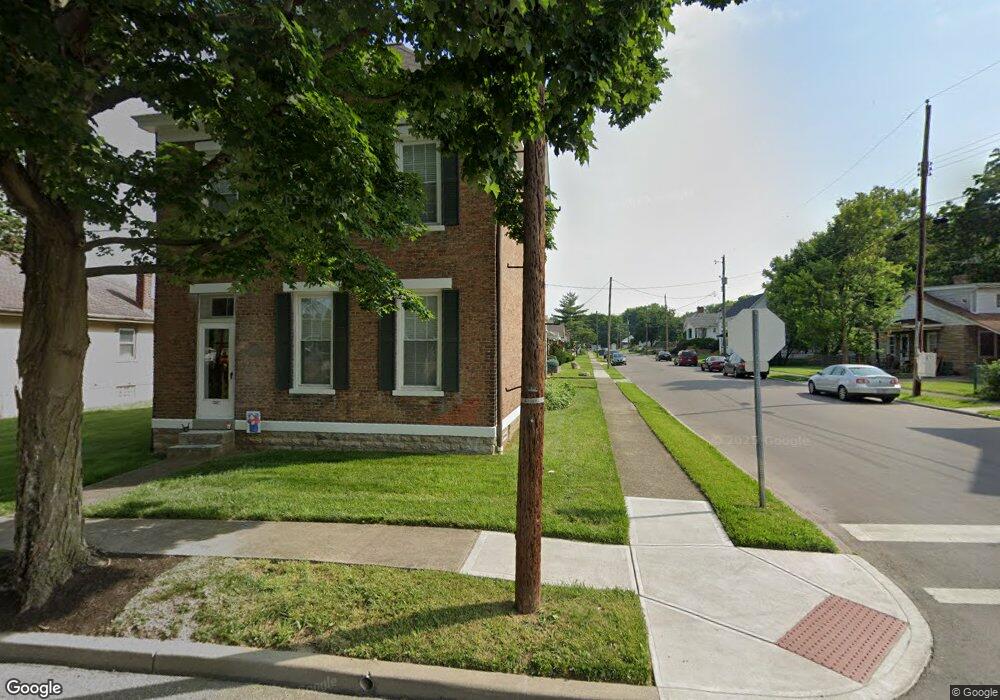
118 E Vine St Cincinnati, OH 45215
Estimated Value: $198,000 - $248,437
4
Beds
2
Baths
2,416
Sq Ft
$94/Sq Ft
Est. Value
About This Home
This home is located at 118 E Vine St, Cincinnati, OH 45215 and is currently estimated at $227,609, approximately $94 per square foot. 118 E Vine St is a home located in Hamilton County with nearby schools including Reading Community High School, Saints Peter and Paul Academy, and Mount Notre Dame High School.
Ownership History
Date
Name
Owned For
Owner Type
Purchase Details
Closed on
Oct 10, 2011
Sold by
Hillyard Susan C
Bought by
Jones Deborah A and Jones William P
Current Estimated Value
Purchase Details
Closed on
Aug 31, 2011
Sold by
Hosmer Constance M
Bought by
Hillyard Susan C and Jones Deborah A
Purchase Details
Closed on
Nov 17, 2009
Sold by
Ruggiero Dolores J and Ruggiero Benedenetto
Bought by
Jones Deborah A
Purchase Details
Closed on
Mar 13, 2009
Sold by
Estate Of Ruby Nickell
Bought by
Hillyard Susan C and Hosmer Constance M
Purchase Details
Closed on
Apr 26, 2007
Sold by
Estate Of Donna L Nickell
Bought by
Nickell Rube
Purchase Details
Closed on
Mar 12, 2001
Sold by
Wood Dolores J
Bought by
Nickell Donna L
Create a Home Valuation Report for This Property
The Home Valuation Report is an in-depth analysis detailing your home's value as well as a comparison with similar homes in the area
Home Values in the Area
Average Home Value in this Area
Purchase History
| Date | Buyer | Sale Price | Title Company |
|---|---|---|---|
| Jones Deborah A | -- | Attorney | |
| Hillyard Susan C | $15,000 | Attorney | |
| Jones Deborah A | -- | Attorney | |
| Hillyard Susan C | -- | None Available | |
| Nickell Rube | -- | None Available | |
| Nickell Donna L | -- | -- |
Source: Public Records
Tax History
| Year | Tax Paid | Tax Assessment Tax Assessment Total Assessment is a certain percentage of the fair market value that is determined by local assessors to be the total taxable value of land and additions on the property. | Land | Improvement |
|---|---|---|---|---|
| 2025 | $2,939 | $55,350 | $9,111 | $46,239 |
| 2023 | $2,915 | $55,350 | $9,111 | $46,239 |
| 2022 | $2,331 | $34,280 | $7,326 | $26,954 |
| 2021 | $1,951 | $34,280 | $7,326 | $26,954 |
| 2020 | $1,967 | $34,280 | $7,326 | $26,954 |
| 2019 | $1,908 | $30,335 | $6,482 | $23,853 |
| 2018 | $1,910 | $30,335 | $6,482 | $23,853 |
| 2017 | $1,803 | $30,335 | $6,482 | $23,853 |
| 2016 | $2,192 | $36,985 | $6,867 | $30,118 |
| 2015 | $2,209 | $36,985 | $6,867 | $30,118 |
| 2014 | $1,933 | $36,985 | $6,867 | $30,118 |
| 2013 | $1,959 | $37,741 | $7,007 | $30,734 |
Source: Public Records
Map
Nearby Homes
- 310 E Vine St
- 1521 Hunt Rd
- 129 Pike St
- 654 3rd St
- 1612 Hunt Rd
- 0 Hill St Unit 1616370
- 1401 Jefferson Ave
- 1421 Jefferson Ave
- 329 Walnut St
- 59 Gorman Ln
- 54 Gorman Ln
- 9350 Reading Rd
- 234 Mcguire Ln
- 18 Gahl Terrace
- 26 Gahl Terrace
- 2113 Bolser Dr
- 311 Southern Ave
- 321 Southern Ave
- 109 Calico Ct
- 103 W Crest Dr
Your Personal Tour Guide
Ask me questions while you tour the home.