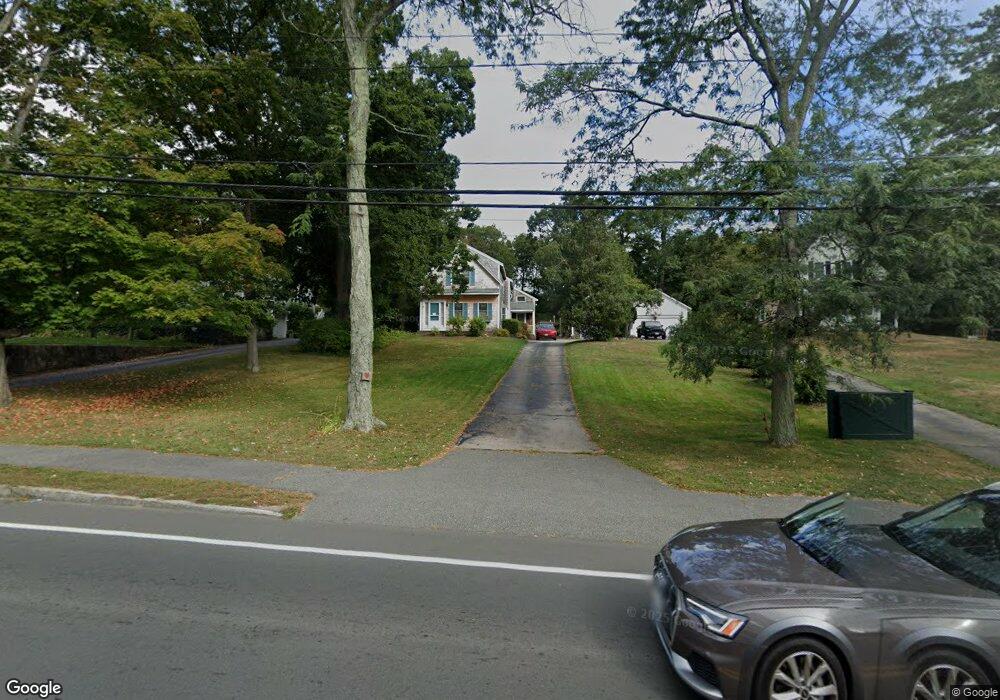
118 East St Hingham, MA 02043
Estimated Value: $994,000 - $1,183,000
3
Beds
3
Baths
1,734
Sq Ft
$628/Sq Ft
Est. Value
About This Home
This home is located at 118 East St, Hingham, MA 02043 and is currently estimated at $1,088,742, approximately $627 per square foot. 118 East St is a home located in Plymouth County with nearby schools including East Elementary School, Hingham Middle School, and Hingham High School.
Ownership History
Date
Name
Owned For
Owner Type
Purchase Details
Closed on
Apr 5, 2022
Sold by
Count Gary W and Count Risa E
Bought by
Count Ft
Current Estimated Value
Purchase Details
Closed on
Aug 23, 1982
Bought by
Count Gary W and Count Risa E
Create a Home Valuation Report for This Property
The Home Valuation Report is an in-depth analysis detailing your home's value as well as a comparison with similar homes in the area
Purchase History
| Date | Buyer | Sale Price | Title Company |
|---|---|---|---|
| Count Ft | -- | None Available | |
| Count Gary W | $78,000 | -- |
Source: Public Records
Mortgage History
| Date | Status | Borrower | Loan Amount |
|---|---|---|---|
| Previous Owner | Count Gary W | $100,000 | |
| Previous Owner | Count Gary W | $138,000 | |
| Previous Owner | Count Gary W | $87,000 | |
| Previous Owner | Count Gary W | $30,000 |
Source: Public Records
Tax History
| Year | Tax Paid | Tax Assessment Tax Assessment Total Assessment is a certain percentage of the fair market value that is determined by local assessors to be the total taxable value of land and additions on the property. | Land | Improvement |
|---|---|---|---|---|
| 2025 | $10,070 | $942,000 | $559,700 | $382,300 |
| 2024 | $9,372 | $863,800 | $559,700 | $304,100 |
| 2023 | $8,496 | $849,600 | $559,700 | $289,900 |
| 2022 | $9,188 | $794,800 | $505,300 | $289,500 |
| 2021 | $8,751 | $741,600 | $485,900 | $255,700 |
| 2020 | $8,551 | $741,600 | $485,900 | $255,700 |
| 2019 | $8,569 | $725,600 | $485,900 | $239,700 |
| 2018 | $8,436 | $716,700 | $485,900 | $230,800 |
| 2017 | $8,486 | $692,700 | $493,400 | $199,300 |
| 2016 | $8,317 | $665,900 | $469,900 | $196,000 |
| 2015 | $7,963 | $635,500 | $447,600 | $187,900 |
Source: Public Records
Map
Nearby Homes
- 82 East St
- 65 East St
- 2 Woodbine Ln
- 9 Barnes Rd
- 1 Rockland St
- 33 Turkey Hill Ln
- 29 Chief Justice Cushing Hwy
- 101 Rockland St
- 14 Spring St
- 10R Martins Ln
- 8 Evergreen Ln
- 10 Popes Ln
- LOT 1B Rockland St
- 112 Martins Ln
- 44 Gilford Rd
- 19 Lantern Ln
- 168 Stayner Dr Unit 168
- 114 Hull St
- 22 Linscott Rd
- 107 Hull St