Estimated Value: $170,048 - $215,000
--
Bed
2
Baths
1,441
Sq Ft
$133/Sq Ft
Est. Value
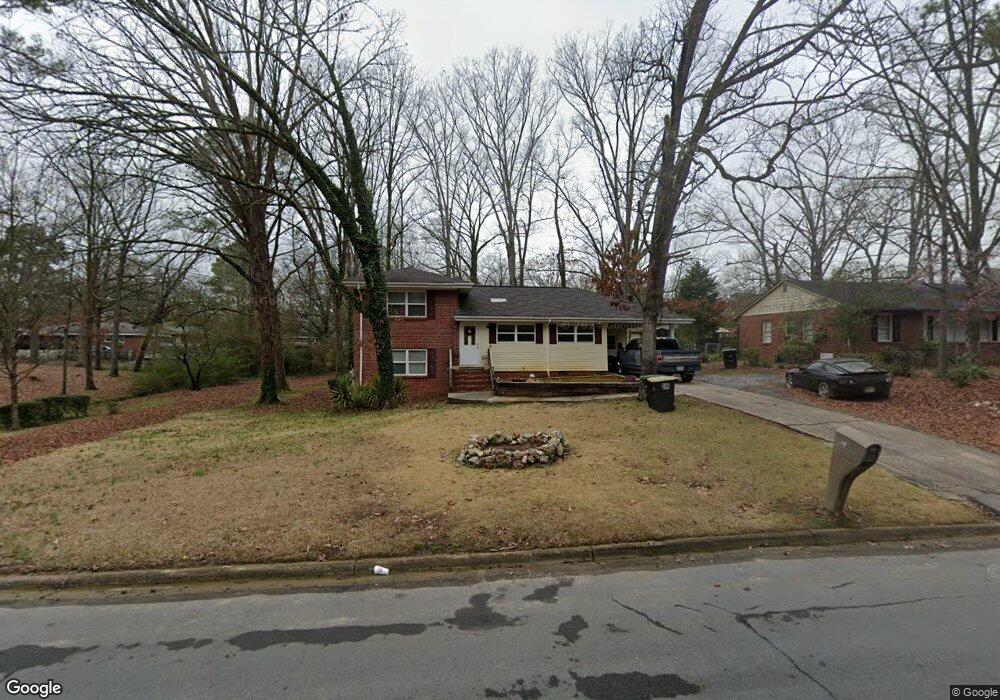
About This Home
This home is located at 118 Echota Cir SW, Rome, GA 30165 and is currently estimated at $191,762, approximately $133 per square foot. 118 Echota Cir SW is a home located in Floyd County with nearby schools including Rome High School.
Ownership History
Date
Name
Owned For
Owner Type
Purchase Details
Closed on
Jul 23, 2007
Sold by
Not Provided
Bought by
Mcclure Cedric
Current Estimated Value
Home Financials for this Owner
Home Financials are based on the most recent Mortgage that was taken out on this home.
Original Mortgage
$100,000
Outstanding Balance
$62,991
Interest Rate
6.65%
Mortgage Type
New Conventional
Estimated Equity
$128,771
Purchase Details
Closed on
Jun 8, 2007
Sold by
Not Provided
Bought by
Mcclure Cedric
Home Financials for this Owner
Home Financials are based on the most recent Mortgage that was taken out on this home.
Original Mortgage
$100,000
Outstanding Balance
$62,991
Interest Rate
6.65%
Mortgage Type
New Conventional
Estimated Equity
$128,771
Purchase Details
Closed on
Apr 3, 2007
Sold by
Not Provided
Bought by
Mcclure Cedric
Purchase Details
Closed on
Feb 20, 2007
Sold by
Not Provided
Bought by
Mcclure Cedric
Purchase Details
Closed on
Aug 12, 1992
Bought by
Holloway Jeannette J
Create a Home Valuation Report for This Property
The Home Valuation Report is an in-depth analysis detailing your home's value as well as a comparison with similar homes in the area
Home Values in the Area
Average Home Value in this Area
Purchase History
| Date | Buyer | Sale Price | Title Company |
|---|---|---|---|
| Mcclure Cedric | $100,000 | -- | |
| Mcclure Cedric | $78,000 | -- | |
| Mcclure Cedric | $46,000 | -- | |
| Mcclure Cedric | $21,500 | -- | |
| Mcclure Cedric | -- | -- | |
| Holloway Jeannette J | $44,900 | -- |
Source: Public Records
Mortgage History
| Date | Status | Borrower | Loan Amount |
|---|---|---|---|
| Open | Mcclure Cedric | $100,000 | |
| Closed | Mcclure Cedric | $77,099 |
Source: Public Records
Tax History Compared to Growth
Tax History
| Year | Tax Paid | Tax Assessment Tax Assessment Total Assessment is a certain percentage of the fair market value that is determined by local assessors to be the total taxable value of land and additions on the property. | Land | Improvement |
|---|---|---|---|---|
| 2024 | $1,756 | $63,588 | $15,252 | $48,336 |
| 2023 | $1,677 | $60,100 | $13,776 | $46,324 |
| 2022 | $1,556 | $49,668 | $11,316 | $38,352 |
| 2021 | $1,441 | $41,996 | $11,316 | $30,680 |
| 2020 | $1,354 | $37,505 | $8,610 | $28,895 |
| 2019 | $1,275 | $35,720 | $8,610 | $27,110 |
| 2018 | $1,127 | $31,727 | $8,610 | $23,117 |
| 2017 | $1,091 | $30,742 | $8,610 | $22,132 |
| 2016 | $1,205 | $33,748 | $8,600 | $25,148 |
| 2015 | $1,151 | $33,748 | $8,600 | $25,148 |
| 2014 | $1,151 | $34,078 | $8,600 | $25,478 |
Source: Public Records
Map
Nearby Homes
- 216 Coosawattee Ave SW
- 25 Ridge Dr SW
- 200 Coosawattee Ave SW
- 43 Westwood Cir SW
- 15 John Ross Dr SW
- 5 Ridge Dr SW
- 3 Oak Ridge Ct NE
- 209 Larkspur Ln SW
- 0 Cedartown Rd Unit 10479932
- 16 Jefferson Dr SW
- 3 Lovell Ln SW
- 111 Deerbrook Dr SW
- 0 Westlyn Dr Unit 10599621
- 0 Westlyn Dr Unit 7645405
- 4 Belmont Dr SW
- 0 Brookvalley Ct SW Unit 10444714
- 0 Brookvalley Ct SW Unit 7512814
- 0 Lovell Ln Unit 7662536
- 0 Lovell Ln Unit 10620627
- 31 Southfork Dr
- 120 Echota Cir SW
- 116 Echota Cir SW
- 121 John Ross Dr SW
- 117 John Ross Dr SW
- 117 Echota Cir SW Unit 48
- 117 Echota Cir SW
- 113 John Ross Dr SW
- 123 John Ross Dr SW
- 115 Echota Cir SW
- 122 Echota Cir SW
- 112 Echota Cir SW
- 113 Echota Cir SW
- 121 Echota Cir SW
- 111 John Ross Dr SW
- 127 John Ross Dr SW
- 124 Echota Cir SW
- 111 Echota Cir SW
- 123 Echota Cir SW
- 109 John Ross Dr SW
- 110 Echota Cir SW