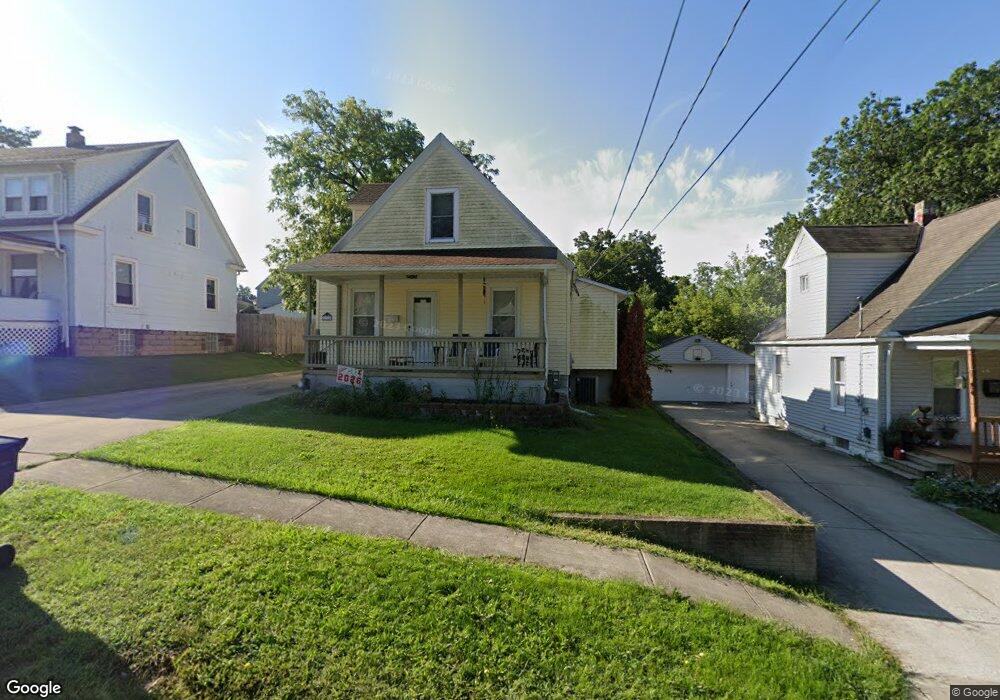
118 Elizabeth St Elyria, OH 44035
Estimated Value: $120,000 - $175,000
2
Beds
2
Baths
924
Sq Ft
$162/Sq Ft
Est. Value
About This Home
This home is located at 118 Elizabeth St, Elyria, OH 44035 and is currently estimated at $149,271, approximately $161 per square foot. 118 Elizabeth St is a home located in Lorain County with nearby schools including Eastern Heights Middle School, Elyria High School, and Constellation Schools: Elyria Community Elementary.
Ownership History
Date
Name
Owned For
Owner Type
Purchase Details
Closed on
Nov 16, 2018
Sold by
Singleton Scott M
Bought by
Sellers Cassie and Adkins Calvin
Current Estimated Value
Home Financials for this Owner
Home Financials are based on the most recent Mortgage that was taken out on this home.
Original Mortgage
$68,732
Outstanding Balance
$59,829
Interest Rate
4.7%
Mortgage Type
New Conventional
Estimated Equity
$89,442
Purchase Details
Closed on
May 6, 1998
Sold by
Schworer Susan L
Bought by
Singleton Scott M
Home Financials for this Owner
Home Financials are based on the most recent Mortgage that was taken out on this home.
Original Mortgage
$45,400
Interest Rate
7.2%
Purchase Details
Closed on
Nov 15, 1994
Sold by
Escobar Robert J
Bought by
Singleton Scott M and Schworre Susan L
Home Financials for this Owner
Home Financials are based on the most recent Mortgage that was taken out on this home.
Original Mortgage
$45,000
Interest Rate
8%
Mortgage Type
New Conventional
Create a Home Valuation Report for This Property
The Home Valuation Report is an in-depth analysis detailing your home's value as well as a comparison with similar homes in the area
Home Values in the Area
Average Home Value in this Area
Purchase History
| Date | Buyer | Sale Price | Title Company |
|---|---|---|---|
| Sellers Cassie | $70,000 | Northstar Title Services Llc | |
| Sellers Cassie | $70,000 | Northstar Title Services Llc | |
| Singleton Scott M | -- | Midland Title | |
| Singleton Scott M | $50,000 | -- |
Source: Public Records
Mortgage History
| Date | Status | Borrower | Loan Amount |
|---|---|---|---|
| Open | Sellers Cassie | $68,732 | |
| Closed | Sellers Cassie | $68,732 | |
| Previous Owner | Singleton Scott M | $45,400 | |
| Previous Owner | Singleton Scott M | $45,000 |
Source: Public Records
Tax History
| Year | Tax Paid | Tax Assessment Tax Assessment Total Assessment is a certain percentage of the fair market value that is determined by local assessors to be the total taxable value of land and additions on the property. | Land | Improvement |
|---|---|---|---|---|
| 2024 | $1,888 | $39,904 | $6,983 | $32,921 |
| 2023 | $1,688 | $30,972 | $7,151 | $23,821 |
| 2022 | $1,682 | $30,972 | $7,151 | $23,821 |
| 2021 | $1,686 | $30,972 | $7,151 | $23,821 |
| 2020 | $1,622 | $26,500 | $6,120 | $20,380 |
| 2019 | $1,611 | $26,500 | $6,120 | $20,380 |
| 2018 | $1,539 | $26,500 | $6,120 | $20,380 |
| 2017 | $1,424 | $21,860 | $6,550 | $15,310 |
| 2016 | $1,406 | $21,860 | $6,550 | $15,310 |
| 2015 | $1,319 | $21,860 | $6,550 | $15,310 |
| 2014 | $1,291 | $21,650 | $6,490 | $15,160 |
| 2013 | $1,280 | $21,650 | $6,490 | $15,160 |
Source: Public Records
Map
Nearby Homes
- 122 Elizabeth St
- 114 Elizabeth St
- 110 Elizabeth St
- 126 Elizabeth St
- 119 Riverdale Ct
- 123 Riverdale Ct
- 115 Riverdale Ct
- 111 Riverdale Ct
- 127 Riverdale Ct
- 119 Elizabeth St
- 123 Elizabeth St
- 115 Elizabeth St
- 111 Elizabeth St
- 109 Elizabeth St
- 1009 E River St
- 127 Elizabeth St
- 1005 E River St
- 1013 E River St
- 997 E River St
- 1017 E River St
Your Personal Tour Guide
Ask me questions while you tour the home.