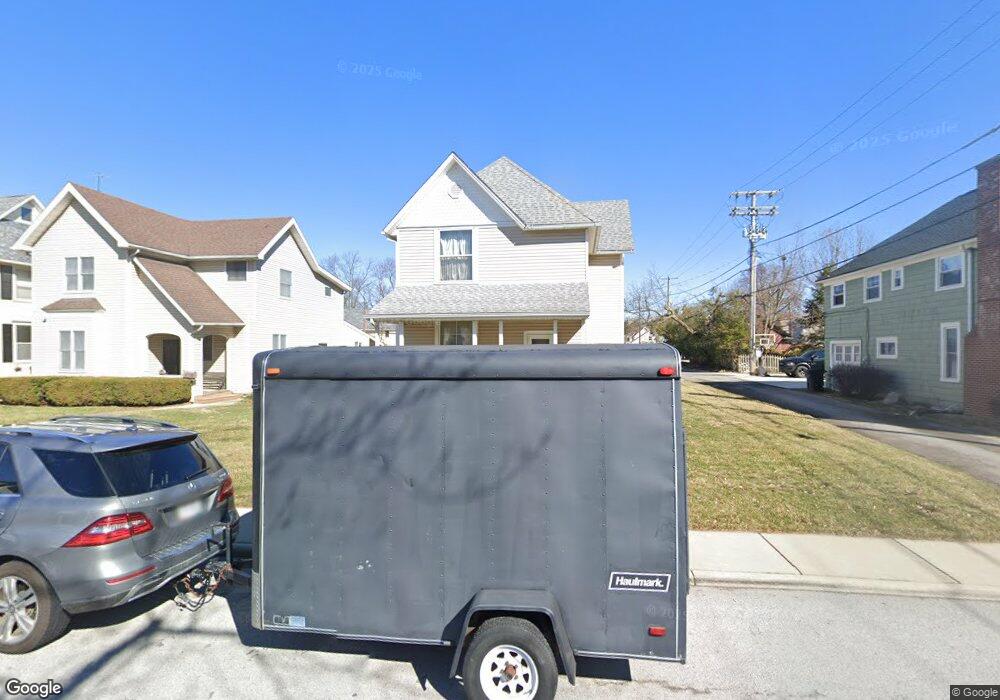
118 Elm St Findlay, OH 45840
Estimated Value: $251,543 - $294,000
4
Beds
2
Baths
2,578
Sq Ft
$107/Sq Ft
Est. Value
About This Home
This home is located at 118 Elm St, Findlay, OH 45840 and is currently estimated at $275,386, approximately $106 per square foot. 118 Elm St is a home located in Hancock County with nearby schools including Lincoln Elementary School, Donnell Middle School, and Findlay High School.
Ownership History
Date
Name
Owned For
Owner Type
Purchase Details
Closed on
May 3, 2004
Sold by
Hover Glen R and Thomas Barbara Ellen
Bought by
Hover Lavera M
Current Estimated Value
Purchase Details
Closed on
Sep 16, 1998
Sold by
Heckathorn Brad
Bought by
Eddington Don and Eddington Jennifer
Home Financials for this Owner
Home Financials are based on the most recent Mortgage that was taken out on this home.
Original Mortgage
$80,250
Outstanding Balance
$17,321
Interest Rate
7.02%
Mortgage Type
New Conventional
Estimated Equity
$258,065
Purchase Details
Closed on
Oct 31, 1995
Sold by
Bower Randy
Bought by
Heckathorn Brad and Heckathorn Michelle
Home Financials for this Owner
Home Financials are based on the most recent Mortgage that was taken out on this home.
Original Mortgage
$61,750
Interest Rate
7.65%
Mortgage Type
New Conventional
Create a Home Valuation Report for This Property
The Home Valuation Report is an in-depth analysis detailing your home's value as well as a comparison with similar homes in the area
Home Values in the Area
Average Home Value in this Area
Purchase History
| Date | Buyer | Sale Price | Title Company |
|---|---|---|---|
| Hover Lavera M | -- | Assured Title | |
| Eddington Don | $77,250 | -- | |
| Heckathorn Brad | $65,000 | -- |
Source: Public Records
Mortgage History
| Date | Status | Borrower | Loan Amount |
|---|---|---|---|
| Open | Eddington Don | $80,250 | |
| Previous Owner | Heckathorn Brad | $61,750 |
Source: Public Records
Tax History Compared to Growth
Tax History
| Year | Tax Paid | Tax Assessment Tax Assessment Total Assessment is a certain percentage of the fair market value that is determined by local assessors to be the total taxable value of land and additions on the property. | Land | Improvement |
|---|---|---|---|---|
| 2024 | $1,473 | $51,280 | $7,670 | $43,610 |
| 2023 | $1,498 | $51,280 | $7,670 | $43,610 |
| 2022 | $2,170 | $69,970 | $7,670 | $62,300 |
| 2021 | $1,666 | $49,690 | $7,850 | $41,840 |
| 2020 | $1,666 | $49,690 | $7,850 | $41,840 |
| 2019 | $1,633 | $49,690 | $7,850 | $41,840 |
| 2018 | $1,471 | $42,560 | $5,530 | $37,030 |
| 2017 | $735 | $42,560 | $5,530 | $37,030 |
| 2016 | $1,455 | $42,560 | $5,530 | $37,030 |
| 2015 | $1,003 | $31,680 | $3,170 | $28,510 |
| 2014 | $1,003 | $31,680 | $3,170 | $28,510 |
| 2012 | $1,013 | $31,680 | $3,170 | $28,510 |
Source: Public Records
Map
Nearby Homes