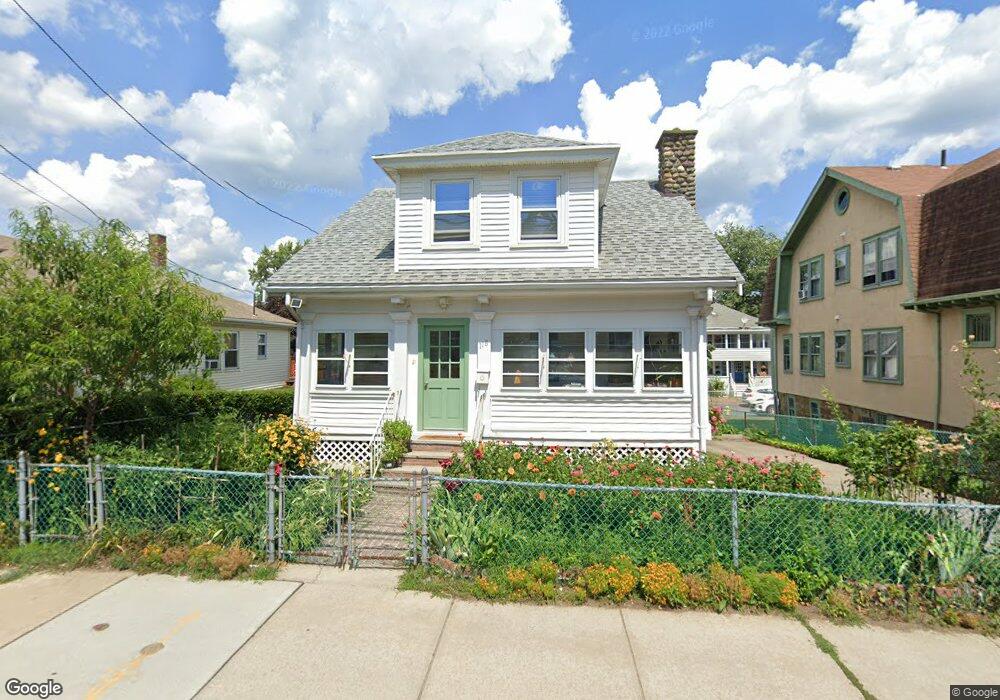
118 Faxon Rd Quincy, MA 02171
North Quincy NeighborhoodEstimated Value: $636,000 - $825,000
4
Beds
2
Baths
1,999
Sq Ft
$374/Sq Ft
Est. Value
About This Home
This home is located at 118 Faxon Rd, Quincy, MA 02171 and is currently estimated at $747,072, approximately $373 per square foot. 118 Faxon Rd is a home located in Norfolk County with nearby schools including Francis W. Parker Elementary School, Atlantic Middle School, and North Quincy High School.
Ownership History
Date
Name
Owned For
Owner Type
Purchase Details
Closed on
Apr 30, 2009
Sold by
Tan Song H and Tan Yue Ez
Bought by
Tan Joanne and Tan Shu
Current Estimated Value
Purchase Details
Closed on
Feb 29, 1988
Sold by
Cushing Tr David
Bought by
Tan Song H
Home Financials for this Owner
Home Financials are based on the most recent Mortgage that was taken out on this home.
Original Mortgage
$80,000
Interest Rate
10.49%
Mortgage Type
Purchase Money Mortgage
Create a Home Valuation Report for This Property
The Home Valuation Report is an in-depth analysis detailing your home's value as well as a comparison with similar homes in the area
Home Values in the Area
Average Home Value in this Area
Purchase History
| Date | Buyer | Sale Price | Title Company |
|---|---|---|---|
| Tan Joanne | -- | -- | |
| Tan Song H | $135,000 | -- |
Source: Public Records
Mortgage History
| Date | Status | Borrower | Loan Amount |
|---|---|---|---|
| Previous Owner | Tan Song H | $80,000 |
Source: Public Records
Tax History Compared to Growth
Tax History
| Year | Tax Paid | Tax Assessment Tax Assessment Total Assessment is a certain percentage of the fair market value that is determined by local assessors to be the total taxable value of land and additions on the property. | Land | Improvement |
|---|---|---|---|---|
| 2025 | $8,359 | $725,000 | $358,900 | $366,100 |
| 2024 | $8,134 | $721,700 | $358,900 | $362,800 |
| 2023 | $7,404 | $665,200 | $326,300 | $338,900 |
| 2022 | $7,139 | $595,900 | $261,100 | $334,800 |
| 2021 | $7,098 | $584,700 | $261,100 | $323,600 |
| 2020 | $7,236 | $582,100 | $255,900 | $326,200 |
| 2019 | $6,690 | $533,100 | $246,100 | $287,000 |
| 2018 | $6,821 | $511,300 | $234,400 | $276,900 |
| 2017 | $6,756 | $476,800 | $213,100 | $263,700 |
| 2016 | $6,475 | $450,900 | $193,700 | $257,200 |
| 2015 | $5,881 | $402,800 | $176,100 | $226,700 |
| 2014 | $5,610 | $377,500 | $176,100 | $201,400 |
Source: Public Records
Map
Nearby Homes
- 6 Warwick St
- 85 E Squantum St Unit 10
- 58 Bayfield Rd S
- 17 Holmes St Unit 2
- 17 Holmes St Unit 4
- 522 Hancock St
- 201 Billings St
- 297 Billings St
- 38 Walker St
- 101 Beach St
- 11 Earle St
- 143 Arlington St
- 115 W Squantum St Unit 907
- 115 W Squantum St Unit 810
- 91 Atlantic St
- 25 Hummock Rd
- 175 Quincy Shore Dr Unit B24
- 250 Fayette St
- 68 Atlantic St
- 212 Quincy Shore Dr
- 124 Faxon Rd
- 124 Faxon Rd Unit 1
- 114 Faxon Rd
- 00 Northquincy Unit 2
- 00 Northquincy
- 126 Faxon Rd
- 126 Faxon Rd Unit 1
- 110 Faxon Rd
- 118 Glover Ave
- 28 Gordon St Unit 1
- 113 Faxon Rd
- 24 Gordon St Unit 1
- 24 Gordon St
- 130 Faxon Rd
- 24 Gordon St
- 128 Faxon Rd
- 106 Faxon Rd
- 109 Faxon Rd
- 36 Gordon St Unit 1
- 20 Gordon St