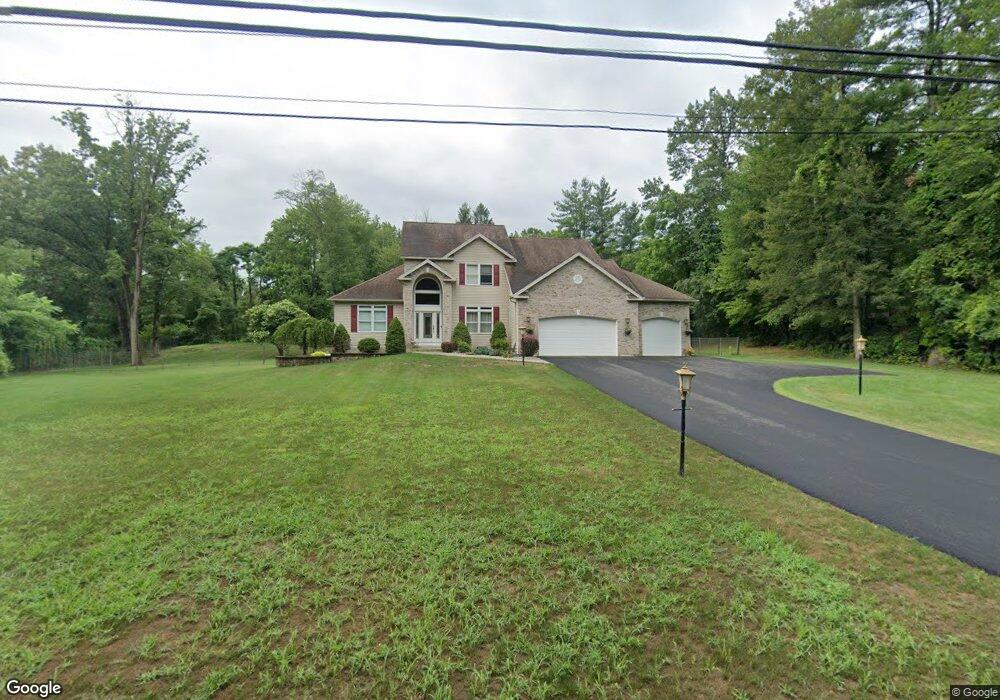
118 Font Grove Rd Slingerlands, NY 12159
Estimated Value: $547,000 - $718,511
3
Beds
3
Baths
2,720
Sq Ft
$242/Sq Ft
Est. Value
About This Home
This home is located at 118 Font Grove Rd, Slingerlands, NY 12159 and is currently estimated at $658,378, approximately $242 per square foot. 118 Font Grove Rd is a home located in Albany County with nearby schools including St. Thomas the Apostle School and Academy of the Holy Names.
Ownership History
Date
Name
Owned For
Owner Type
Purchase Details
Closed on
Aug 3, 2006
Sold by
Cornerstone Const Of Upst Ate Ny Inc
Bought by
Seres John E
Current Estimated Value
Home Financials for this Owner
Home Financials are based on the most recent Mortgage that was taken out on this home.
Original Mortgage
$405,000
Outstanding Balance
$242,362
Interest Rate
6.7%
Estimated Equity
$416,016
Purchase Details
Closed on
Nov 14, 2005
Sold by
Fleetway Construction Co
Bought by
Cornerstone Construction
Purchase Details
Closed on
Aug 7, 2001
Sold by
Trustees Schade Bernard E,William B
Bought by
Fleetway Construction Co Inc.
Purchase Details
Closed on
Oct 30, 1998
Sold by
Schade Marie N
Bought by
Schade Marie N Trustees Schade/Dorsman Bernar
Purchase Details
Closed on
Jun 26, 1995
Sold by
Schade Charles A Schade Marie
Bought by
Schade Charles A and Schade Marie N
Create a Home Valuation Report for This Property
The Home Valuation Report is an in-depth analysis detailing your home's value as well as a comparison with similar homes in the area
Home Values in the Area
Average Home Value in this Area
Purchase History
| Date | Buyer | Sale Price | Title Company |
|---|---|---|---|
| Seres John E | $449,900 | Larry P Kivitz | |
| Seres John E | $450,000 | Northeast Title & Abstract C | |
| Cornerstone Construction | $100,000 | -- | |
| Fleetway Construction Co Inc. | $62,500 | Abraham Dorman | |
| Schade Marie N Trustees Schade/Dorsman Bernar | -- | -- | |
| Schade Charles A | -- | -- |
Source: Public Records
Mortgage History
| Date | Status | Borrower | Loan Amount |
|---|---|---|---|
| Open | Seres John E | $405,000 |
Source: Public Records
Tax History Compared to Growth
Tax History
| Year | Tax Paid | Tax Assessment Tax Assessment Total Assessment is a certain percentage of the fair market value that is determined by local assessors to be the total taxable value of land and additions on the property. | Land | Improvement |
|---|---|---|---|---|
| 2024 | $12,768 | $398,200 | $115,000 | $283,200 |
| 2023 | $12,368 | $398,200 | $115,000 | $283,200 |
| 2022 | $11,999 | $398,200 | $115,000 | $283,200 |
| 2021 | $12,074 | $398,200 | $115,000 | $283,200 |
| 2020 | $11,998 | $398,200 | $115,000 | $283,200 |
| 2019 | $10,839 | $398,200 | $115,000 | $283,200 |
| 2018 | $11,757 | $398,200 | $115,000 | $283,200 |
| 2017 | $11,487 | $398,200 | $115,000 | $283,200 |
| 2016 | $11,487 | $398,200 | $115,000 | $283,200 |
| 2015 | -- | $398,200 | $115,000 | $283,200 |
| 2014 | -- | $398,200 | $115,000 | $283,200 |
Source: Public Records
Map
Nearby Homes
- 15A Font Grove Rd
- 1575 New Scotland Rd
- 10 Gailes Dr
- 12 Bradford Place
- 117 Brockley Dr
- 82 Brockley Dr
- L23 Maple Rd
- 11 Wakefield Ct
- 38 Capricorn Ln
- 47 Tekakwitha Rd
- 23 Canterbury Ln
- 10 Canterbury Ln
- 532 Wayne Place
- 481 Huron Rd
- 1 Van Dyke Rd
- 20 Gardner Terrace
- 425A Bullock Rd
- 19 Youmans Rd
- 531 Delaware Ave
- 41 Mountainview Ave
- 114 Font Grove Rd
- 120 Font Grove Rd
- 111 Font Grove Rd
- 123 Font Grove Rd
- 112 Font Grove Rd
- 74 Carstead Dr
- 78 Carstead Dr
- 70 Carstead Dr
- 84 Carstead Dr
- 127 Font Grove Rd
- 68 Carstead Dr
- 110 Font Grove Rd
- 88 Carstead Dr
- 91 Font Grove Rd
- 00000 Fathers Way
- 00 Fathers Way
- 0000 Fathers Way
- 000 Fathers Way
- 000000 Fathers Way
- 81 Carstead Dr