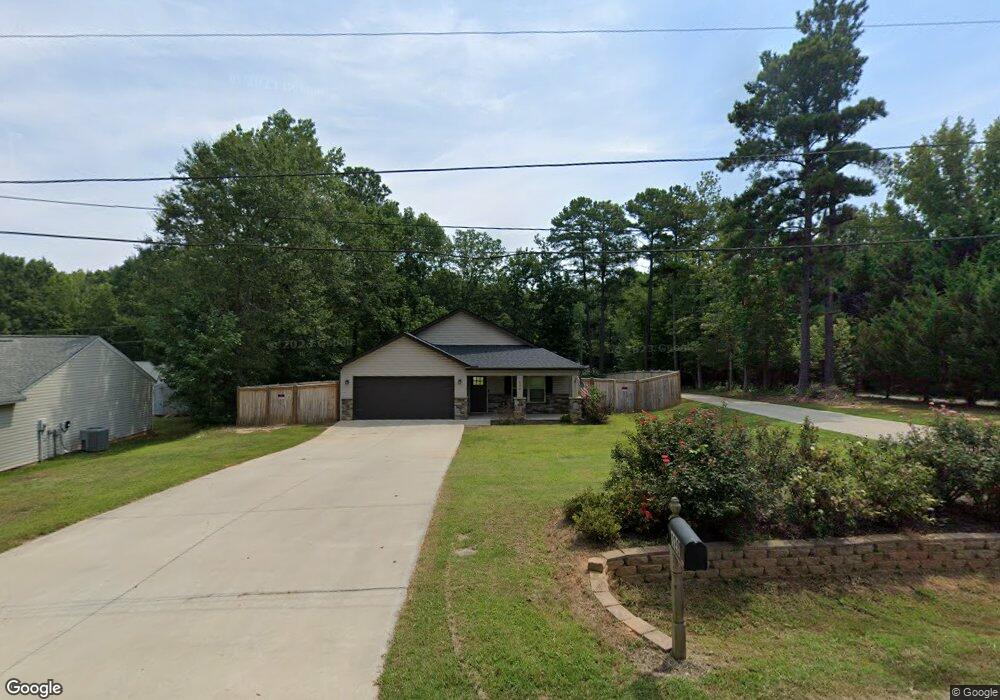
118 Forrest Dr Unit Fountain Inn Fountain Inn, SC 29644
Estimated Value: $291,000 - $303,000
3
Beds
3
Baths
1,354
Sq Ft
$220/Sq Ft
Est. Value
About This Home
This home is located at 118 Forrest Dr Unit Fountain Inn, Fountain Inn, SC 29644 and is currently estimated at $297,369, approximately $219 per square foot. 118 Forrest Dr Unit Fountain Inn is a home located in Greenville County with nearby schools including Fountain Inn Elementary School, Bryson Middle School, and Fountain Inn Christian School.
Ownership History
Date
Name
Owned For
Owner Type
Purchase Details
Closed on
Apr 25, 2025
Sold by
Graham Hayden L and Calloway-Graham Cammi E
Bought by
Ruff Ethan
Current Estimated Value
Home Financials for this Owner
Home Financials are based on the most recent Mortgage that was taken out on this home.
Original Mortgage
$239,200
Outstanding Balance
$238,138
Interest Rate
6.65%
Mortgage Type
New Conventional
Estimated Equity
$59,231
Purchase Details
Closed on
Oct 28, 2022
Sold by
Gainey David
Bought by
Graham Hayden L and Calloway-Graham Cammi E
Home Financials for this Owner
Home Financials are based on the most recent Mortgage that was taken out on this home.
Original Mortgage
$265,980
Interest Rate
6.92%
Mortgage Type
VA
Purchase Details
Closed on
Mar 6, 2020
Sold by
Bullock Michael and Bullock Rebekab
Bought by
Gainey David
Create a Home Valuation Report for This Property
The Home Valuation Report is an in-depth analysis detailing your home's value as well as a comparison with similar homes in the area
Home Values in the Area
Average Home Value in this Area
Purchase History
| Date | Buyer | Sale Price | Title Company |
|---|---|---|---|
| Ruff Ethan | $299,000 | None Listed On Document | |
| Ruff Ethan | $299,000 | None Listed On Document | |
| Graham Hayden L | $260,000 | -- | |
| Gainey David | $182,000 | None Available |
Source: Public Records
Mortgage History
| Date | Status | Borrower | Loan Amount |
|---|---|---|---|
| Open | Ruff Ethan | $239,200 | |
| Closed | Ruff Ethan | $239,200 | |
| Previous Owner | Graham Hayden L | $265,980 |
Source: Public Records
Tax History Compared to Growth
Tax History
| Year | Tax Paid | Tax Assessment Tax Assessment Total Assessment is a certain percentage of the fair market value that is determined by local assessors to be the total taxable value of land and additions on the property. | Land | Improvement |
|---|---|---|---|---|
| 2024 | $2,097 | $10,130 | $1,100 | $9,030 |
| 2023 | $2,097 | $10,130 | $1,100 | $9,030 |
| 2022 | $1,477 | $7,000 | $1,000 | $6,000 |
| 2021 | $1,440 | $7,000 | $1,000 | $6,000 |
| 2019 | $1,335 | $5,810 | $680 | $5,130 |
| 2018 | $1,333 | $5,810 | $680 | $5,130 |
Source: Public Records
Map
Nearby Homes
- 109 Blue Ridge Dr
- 628 Hellams St
- 416 Scarlet Oak Dr
- 118 Sylvester St
- 513 Scarlet Oak Dr
- 119A Woodland Dr
- 501 Fountain Brook Ln
- 300 Stockland Trail
- 203 Addlestone Cir
- 19 Kendals Ln
- 8 Single Oak Ct
- 139 Hughes St
- 102 Sagewood Ct
- 259 Inn Cir
- 100 Belmont Dr
- 300 Woodvale Ave
- 105 Belmont Dr
- 201A Belmont Dr
- 432 Icebow Rd
- Salem Plan at Durbin Meadows - Traditions
- 136 Forrest Dr
- 120 Forrest Dr
- 130 Forrest Dr
- 114 Forrest Dr
- 142 Forrest Dr
- 116 Forrest Dr
- 112 Forrest Dr
- 150 Forrest Dr
- 110 Forrest Dr
- 160 Forrest Dr
- 210 Woodfield Ave
- 208 Woodfield Ave
- 210 Forrest Dr
- 108 Forrest Dr
- 206 Woodfield Ave
- 8 Lawrence Ward Ct
- 6 Lawrence Ward Ct
- 2 Charlie Way
- 106 Forrest Dr
- 4 Charlie Way