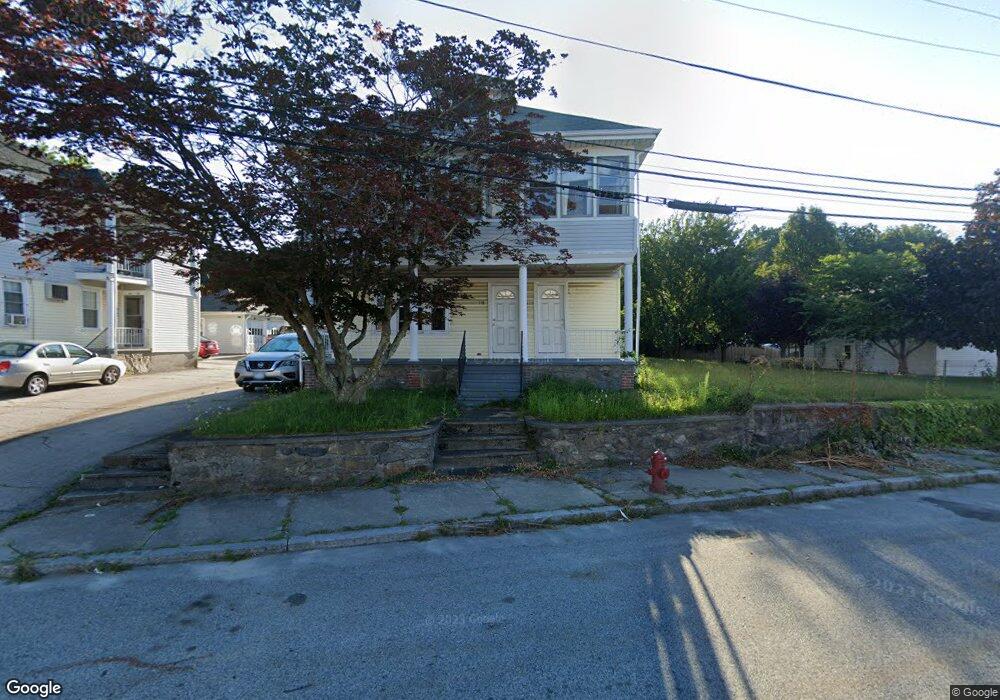
118 Fournier St Woonsocket, RI 02895
Bernon District NeighborhoodEstimated Value: $425,510 - $532,000
6
Beds
2
Baths
5,652
Sq Ft
$88/Sq Ft
Est. Value
About This Home
This home is located at 118 Fournier St, Woonsocket, RI 02895 and is currently estimated at $497,628, approximately $88 per square foot. 118 Fournier St is a home located in Providence County with nearby schools including Woonsocket High School, Founders Academy, and Beacon Charter School.
Ownership History
Date
Name
Owned For
Owner Type
Purchase Details
Closed on
Sep 13, 2010
Sold by
Fnma
Bought by
Campbell Jenna
Current Estimated Value
Home Financials for this Owner
Home Financials are based on the most recent Mortgage that was taken out on this home.
Original Mortgage
$148,262
Outstanding Balance
$98,447
Interest Rate
4.55%
Mortgage Type
Purchase Money Mortgage
Estimated Equity
$399,181
Purchase Details
Closed on
Apr 26, 2010
Sold by
Vongvixay Soum
Bought by
Jp Morgan Chase Bk
Purchase Details
Closed on
Jul 18, 2005
Sold by
Almeida Joseph A
Bought by
Vongvixay Soum
Home Financials for this Owner
Home Financials are based on the most recent Mortgage that was taken out on this home.
Original Mortgage
$197,600
Interest Rate
5.67%
Mortgage Type
Purchase Money Mortgage
Create a Home Valuation Report for This Property
The Home Valuation Report is an in-depth analysis detailing your home's value as well as a comparison with similar homes in the area
Home Values in the Area
Average Home Value in this Area
Purchase History
| Date | Buyer | Sale Price | Title Company |
|---|---|---|---|
| Campbell Jenna | $155,000 | -- | |
| Campbell Jenna | $155,000 | -- | |
| Jp Morgan Chase Bk | $197,600 | -- | |
| Jp Morgan Chase Bk | $197,600 | -- | |
| Vongvixay Soum | $247,000 | -- | |
| Vongvixay Soum | $247,000 | -- |
Source: Public Records
Mortgage History
| Date | Status | Borrower | Loan Amount |
|---|---|---|---|
| Open | Vongvixay Soum | $148,262 | |
| Closed | Vongvixay Soum | $148,262 | |
| Previous Owner | Vongvixay Soum | $197,600 |
Source: Public Records
Tax History Compared to Growth
Tax History
| Year | Tax Paid | Tax Assessment Tax Assessment Total Assessment is a certain percentage of the fair market value that is determined by local assessors to be the total taxable value of land and additions on the property. | Land | Improvement |
|---|---|---|---|---|
| 2024 | $4,685 | $322,200 | $95,200 | $227,000 |
| 2023 | $4,504 | $322,200 | $95,200 | $227,000 |
| 2022 | $4,504 | $322,200 | $95,200 | $227,000 |
| 2021 | $3,764 | $158,500 | $59,900 | $98,600 |
| 2020 | $3,804 | $158,500 | $59,900 | $98,600 |
| 2018 | $3,817 | $158,500 | $59,900 | $98,600 |
| 2017 | $4,458 | $148,100 | $46,800 | $101,300 |
| 2016 | $4,716 | $148,100 | $46,800 | $101,300 |
| 2015 | $5,417 | $148,100 | $46,800 | $101,300 |
| 2014 | $5,233 | $145,600 | $51,500 | $94,100 |
Source: Public Records
Map
Nearby Homes
- 0 Laflamme Ave
- 0 Caron Ave Unit 1379503
- 0 Caron Ave Unit 73342710
- 61 Warwick St
- 97 Warwick St
- 147 Warwick St
- 25 Ormond St
- 0 Chester St
- 58 Cranston St
- 2 Raymond St
- 36 Old Louisquisset Pike Unit 104
- 36 Old Louisquisset Pike Unit 204
- 36 Old Louisquisset Pike Unit 206
- 36 Old Louisquisset Pike Unit 109
- 36 Old Louisquisset Pike Unit 105
- 36 Old Louisquisset Pike Unit 107
- 36 Old Louisquisset Pike Unit 106
- 36 Old Louisquisset Pike Unit 208
- 36 Old Louisquisset Pike Unit 108
- 36 Old Louisquisset Pike Unit 202