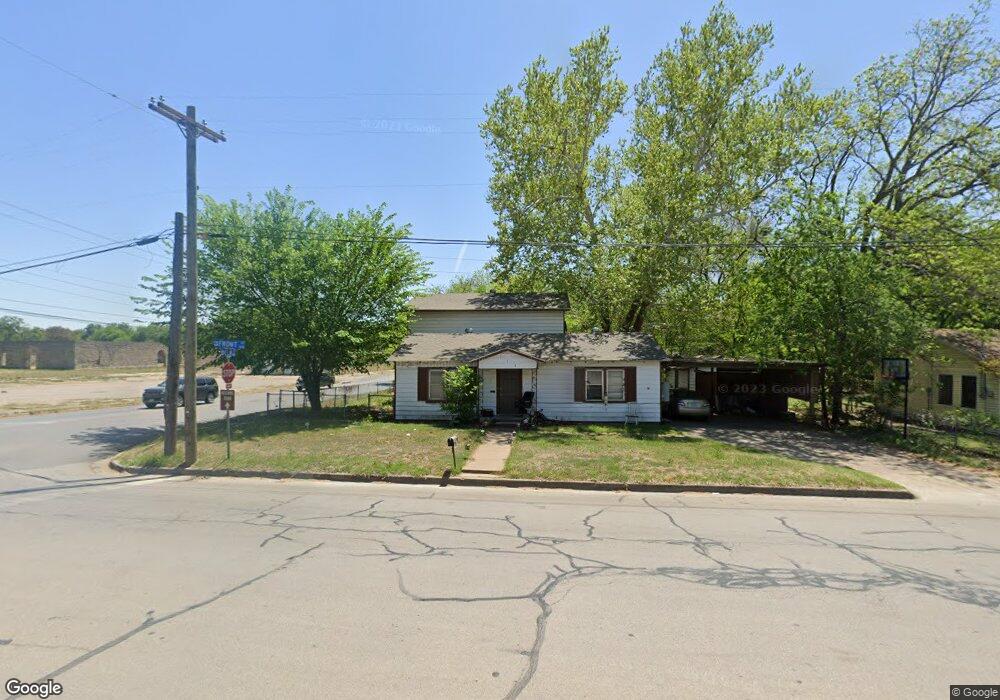
118 Front St Weatherford, TX 76086
Estimated Value: $274,000 - $321,000
3
Beds
2
Baths
2,556
Sq Ft
$115/Sq Ft
Est. Value
About This Home
This home is located at 118 Front St, Weatherford, TX 76086 and is currently estimated at $295,103, approximately $115 per square foot. 118 Front St is a home located in Parker County with nearby schools including Seguin Elementary School, Tison Middle School, and Weatherford High School.
Ownership History
Date
Name
Owned For
Owner Type
Purchase Details
Closed on
Nov 16, 2012
Sold by
Rule Scott D
Bought by
Bank Of America Na
Current Estimated Value
Purchase Details
Closed on
Nov 6, 2012
Sold by
Rule Scott D
Bought by
Hendrick Floyd
Purchase Details
Closed on
Apr 18, 2011
Sold by
Bank Of America Na
Bought by
Hendrick Floyd
Purchase Details
Closed on
Apr 12, 2004
Sold by
Fuller Cecil L
Bought by
Hendrick Floyd
Create a Home Valuation Report for This Property
The Home Valuation Report is an in-depth analysis detailing your home's value as well as a comparison with similar homes in the area
Home Values in the Area
Average Home Value in this Area
Purchase History
| Date | Buyer | Sale Price | Title Company |
|---|---|---|---|
| Bank Of America Na | $94,500 | Lsi Title Agency Inc | |
| Hendrick Floyd | -- | -- | |
| Hendrick Floyd | -- | None Available | |
| Hendrick Floyd | -- | -- |
Source: Public Records
Tax History Compared to Growth
Tax History
| Year | Tax Paid | Tax Assessment Tax Assessment Total Assessment is a certain percentage of the fair market value that is determined by local assessors to be the total taxable value of land and additions on the property. | Land | Improvement |
|---|---|---|---|---|
| 2025 | $3,557 | $187,440 | $50,000 | $137,440 |
| 2024 | $3,557 | $184,560 | $50,000 | $134,560 |
| 2023 | $3,557 | $184,560 | $50,000 | $134,560 |
| 2022 | $3,169 | $142,850 | $22,770 | $120,080 |
| 2021 | $3,431 | $142,850 | $22,770 | $120,080 |
| 2020 | $2,011 | $83,220 | $22,770 | $60,450 |
| 2019 | $2,125 | $83,220 | $22,770 | $60,450 |
| 2018 | $1,691 | $65,930 | $22,770 | $43,160 |
| 2017 | $1,735 | $65,930 | $22,770 | $43,160 |
| 2016 | $1,568 | $59,610 | $22,770 | $36,840 |
| 2015 | $1,536 | $59,610 | $22,770 | $36,840 |
| 2014 | $2,344 | $93,340 | $22,770 | $70,570 |
Source: Public Records
Map
Nearby Homes