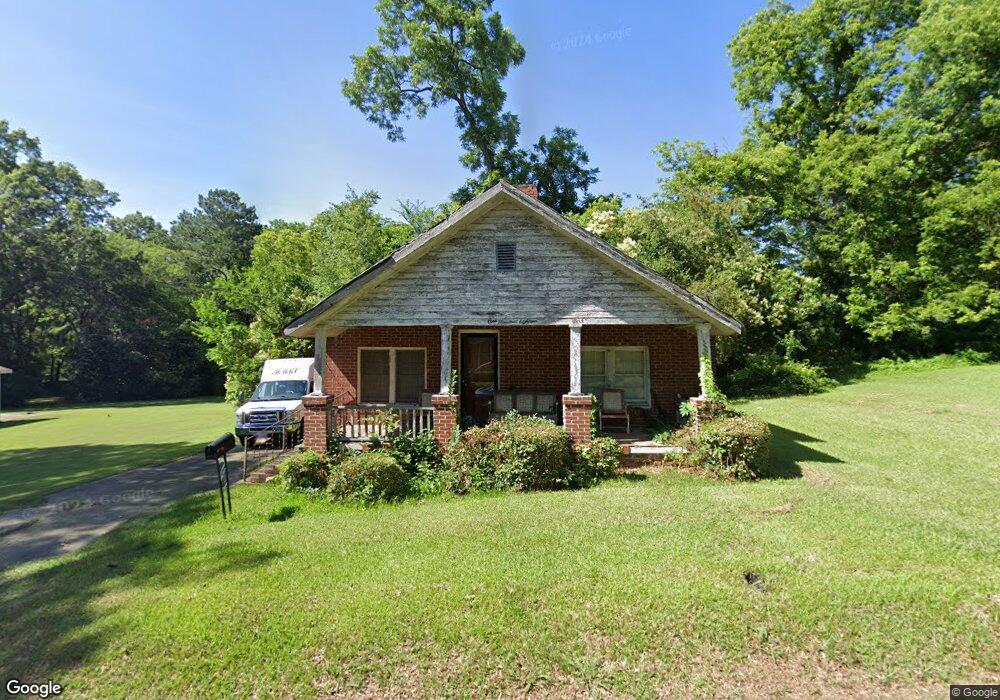
118 Graham St Chester, SC 29706
Estimated Value: $83,778 - $216,000
--
Bed
--
Bath
1,152
Sq Ft
$137/Sq Ft
Est. Value
About This Home
This home is located at 118 Graham St, Chester, SC 29706 and is currently estimated at $158,195, approximately $137 per square foot. 118 Graham St is a home located in Chester County with nearby schools including Chester Park Center of Literacy Through Technology (COLT), Chester Park Elementary School for the Arts, and Chester Park School of Inquiry.
Ownership History
Date
Name
Owned For
Owner Type
Purchase Details
Closed on
Jul 18, 1998
Sold by
Bowswe Barbara G
Bought by
Bowser Rouse Mary Frances
Current Estimated Value
Create a Home Valuation Report for This Property
The Home Valuation Report is an in-depth analysis detailing your home's value as well as a comparison with similar homes in the area
Home Values in the Area
Average Home Value in this Area
Purchase History
| Date | Buyer | Sale Price | Title Company |
|---|---|---|---|
| Bowser Rouse Mary Frances | -- | -- |
Source: Public Records
Tax History Compared to Growth
Tax History
| Year | Tax Paid | Tax Assessment Tax Assessment Total Assessment is a certain percentage of the fair market value that is determined by local assessors to be the total taxable value of land and additions on the property. | Land | Improvement |
|---|---|---|---|---|
| 2024 | $1,634 | $2,790 | $300 | $2,490 |
| 2023 | $1,634 | $2,630 | $300 | $2,330 |
| 2022 | $1,584 | $2,790 | $300 | $2,490 |
| 2021 | $1,532 | $2,790 | $300 | $2,490 |
| 2020 | $1,385 | $2,290 | $300 | $1,990 |
| 2019 | $1,394 | $2,290 | $300 | $1,990 |
| 2018 | $1,314 | $2,290 | $300 | $1,990 |
| 2017 | $1,296 | $2,290 | $300 | $1,990 |
| 2015 | -- | $2,290 | $300 | $1,990 |
| 2010 | -- | $2,290 | $300 | $1,990 |
Source: Public Records
Map
Nearby Homes