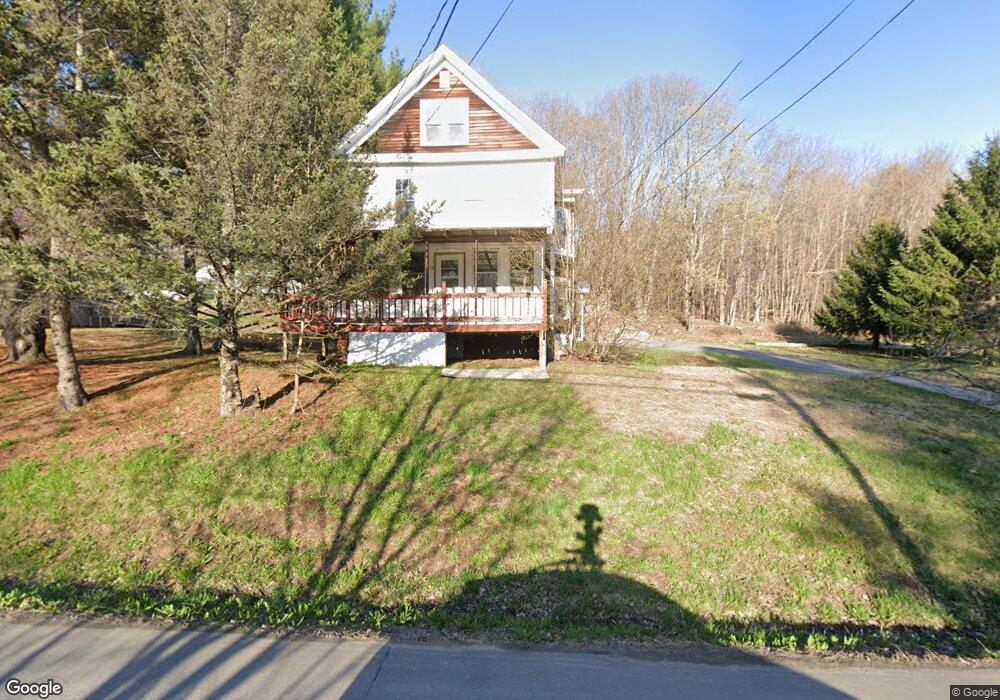
118 High St Dexter, ME 04930
Estimated Value: $182,000
--
Bed
2
Baths
1,920
Sq Ft
$95/Sq Ft
Est. Value
About This Home
This home is located at 118 High St, Dexter, ME 04930 and is currently estimated at $182,000, approximately $94 per square foot. 118 High St is a home located in Penobscot County with nearby schools including Ridge View Community School, Dexter Regional High School, and Dexter Christian Academy.
Ownership History
Date
Name
Owned For
Owner Type
Purchase Details
Closed on
Aug 1, 2013
Sold by
Fhlmc
Bought by
Lancaster Clifton G
Current Estimated Value
Purchase Details
Closed on
Apr 11, 2013
Sold by
Coleman Donald E and Bank Of America Na
Bought by
Fhlmc
Purchase Details
Closed on
Aug 16, 2011
Sold by
Coleman Charlene L and Emc Mortgage Corp
Bought by
Countrywide Home Loans and Bac Home Loans Svcng Lp
Create a Home Valuation Report for This Property
The Home Valuation Report is an in-depth analysis detailing your home's value as well as a comparison with similar homes in the area
Home Values in the Area
Average Home Value in this Area
Purchase History
| Date | Buyer | Sale Price | Title Company |
|---|---|---|---|
| Lancaster Clifton G | $9,900 | -- | |
| Fhlmc | -- | -- | |
| Fhlmc | -- | -- | |
| Countrywide Home Loans | -- | -- | |
| Countrywide Home Loans | -- | -- |
Source: Public Records
Tax History Compared to Growth
Tax History
| Year | Tax Paid | Tax Assessment Tax Assessment Total Assessment is a certain percentage of the fair market value that is determined by local assessors to be the total taxable value of land and additions on the property. | Land | Improvement |
|---|---|---|---|---|
| 2024 | $1,562 | $79,700 | $12,700 | $67,000 |
| 2023 | $1,574 | $79,900 | $12,900 | $67,000 |
| 2022 | $1,574 | $78,700 | $11,700 | $67,000 |
| 2021 | $1,543 | $78,700 | $11,700 | $67,000 |
| 2020 | $1,543 | $78,700 | $11,700 | $67,000 |
| 2019 | $1,543 | $78,700 | $11,700 | $67,000 |
| 2018 | $1,543 | $78,700 | $11,700 | $67,000 |
| 2017 | $1,503 | $78,700 | $11,700 | $67,000 |
| 2016 | $1,464 | $78,700 | $11,700 | $67,000 |
| 2015 | $1,464 | $78,700 | $11,700 | $67,000 |
| 2014 | $1,389 | $78,500 | $11,700 | $66,800 |
Source: Public Records
Map
Nearby Homes