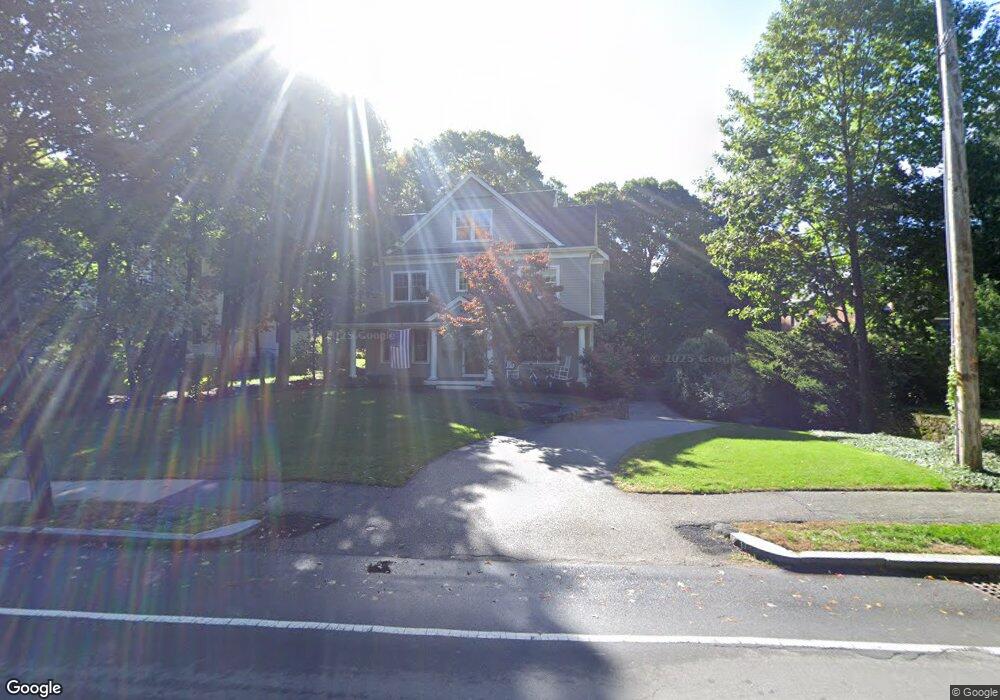
118 Homer St Newton Center, MA 02459
Newton Centre NeighborhoodEstimated Value: $1,994,000 - $3,471,000
4
Beds
5
Baths
4,678
Sq Ft
$640/Sq Ft
Est. Value
About This Home
This home is located at 118 Homer St, Newton Center, MA 02459 and is currently estimated at $2,992,085, approximately $639 per square foot. 118 Homer St is a home located in Middlesex County with nearby schools including Mason Rice Elementary School, Charles E Brown Middle School, and Newton South High School.
Ownership History
Date
Name
Owned For
Owner Type
Purchase Details
Closed on
Jul 19, 2022
Sold by
Stevenson Richard M and Stevenson Diane M
Bought by
D M Stevenson Ret 2022
Current Estimated Value
Purchase Details
Closed on
Aug 4, 2009
Sold by
Grant Mary
Bought by
Stevenson Richard M and Stevenson Diane M
Home Financials for this Owner
Home Financials are based on the most recent Mortgage that was taken out on this home.
Original Mortgage
$417,000
Interest Rate
5.43%
Mortgage Type
Purchase Money Mortgage
Purchase Details
Closed on
Aug 26, 2004
Sold by
Berlove David and Berlove Orlee
Bought by
Grant Mary
Purchase Details
Closed on
Mar 15, 2001
Sold by
Freedman Jeffrey M and Freedman Judith N
Bought by
Berlove David and Berlove Orlee
Home Financials for this Owner
Home Financials are based on the most recent Mortgage that was taken out on this home.
Original Mortgage
$50,000
Interest Rate
7.01%
Create a Home Valuation Report for This Property
The Home Valuation Report is an in-depth analysis detailing your home's value as well as a comparison with similar homes in the area
Home Values in the Area
Average Home Value in this Area
Purchase History
| Date | Buyer | Sale Price | Title Company |
|---|---|---|---|
| D M Stevenson Ret 2022 | -- | None Available | |
| Stevenson Richard M | $600,000 | -- | |
| Grant Mary | $735,000 | -- | |
| Berlove David | $598,260 | -- |
Source: Public Records
Mortgage History
| Date | Status | Borrower | Loan Amount |
|---|---|---|---|
| Previous Owner | Berlove David | $417,000 | |
| Previous Owner | Stevenson Richard M | $417,000 | |
| Previous Owner | Berlove David | $50,000 | |
| Previous Owner | Berlove David | $275,000 |
Source: Public Records
Tax History Compared to Growth
Tax History
| Year | Tax Paid | Tax Assessment Tax Assessment Total Assessment is a certain percentage of the fair market value that is determined by local assessors to be the total taxable value of land and additions on the property. | Land | Improvement |
|---|---|---|---|---|
| 2025 | $29,960 | $3,057,100 | $1,190,100 | $1,867,000 |
| 2024 | $28,969 | $2,968,100 | $1,155,400 | $1,812,700 |
| 2023 | $27,915 | $2,742,100 | $890,400 | $1,851,700 |
| 2022 | $26,710 | $2,539,000 | $824,400 | $1,714,600 |
| 2021 | $25,773 | $2,395,300 | $777,700 | $1,617,600 |
| 2020 | $25,007 | $2,395,300 | $777,700 | $1,617,600 |
| 2019 | $24,301 | $2,325,500 | $755,000 | $1,570,500 |
| 2018 | $23,331 | $2,156,300 | $677,100 | $1,479,200 |
| 2017 | $22,620 | $2,034,200 | $638,800 | $1,395,400 |
| 2016 | $21,635 | $1,901,100 | $597,000 | $1,304,100 |
| 2015 | $18,071 | $1,556,500 | $557,900 | $998,600 |
Source: Public Records
Map
Nearby Homes
- Lots 2 & 3 Chapin Rd
- Lot 3 Chapin Rd
- Lot 2 Chapin Rd
- 59 Charlotte Rd
- 73 Elmore St
- 887 Commonwealth Ave
- 1004 Centre St
- 34 Morton Rd
- 3 Cedar St
- 54 Garland Rd
- 44 Irving St
- 21 Francis St Unit 21A
- 23 Francis St Unit 23-1
- 173-175 Warren St
- 9 Ripley St Unit 1
- 956 Walnut St Unit 4
- 956 Walnut St Unit 7
- 956 Walnut St Unit 6
- 1114 Beacon St Unit 106
- 1114 Beacon St Unit 203