Estimated Value: $332,000 - $412,000
3
Beds
3
Baths
1,949
Sq Ft
$184/Sq Ft
Est. Value
About This Home
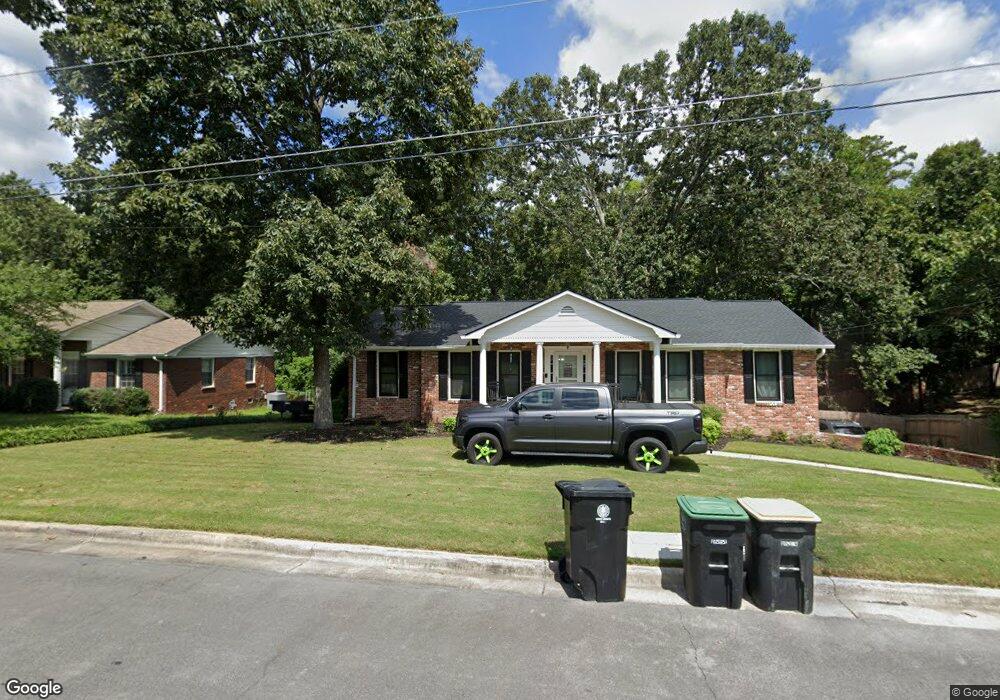
This home is located at 118 Hycliff Rd SW Unit 40, Rome, GA 30165 and is currently estimated at $357,824, approximately $183 per square foot. 118 Hycliff Rd SW Unit 40 is a home located in Floyd County with nearby schools including Rome High School.
Ownership History
Date
Name
Owned For
Owner Type
Purchase Details
Closed on
Nov 20, 2020
Sold by
Beehive Homes Llc
Bought by
Hardin Robert
Current Estimated Value
Home Financials for this Owner
Home Financials are based on the most recent Mortgage that was taken out on this home.
Original Mortgage
$250,381
Outstanding Balance
$221,517
Interest Rate
2.8%
Mortgage Type
FHA
Estimated Equity
$136,307
Purchase Details
Closed on
Jul 27, 2020
Sold by
Cook Doris Anita
Bought by
Beehive Homes Llc
Purchase Details
Closed on
Aug 28, 2012
Sold by
Cook Jammie W and Cook Doris Anita
Bought by
Cook Doris Anita
Purchase Details
Closed on
Jan 5, 2006
Sold by
Not Provided
Bought by
Cook Jammie W and Doris Anita Cook
Purchase Details
Closed on
Jul 13, 1972
Sold by
Fowler James F and Fowler Ann W
Bought by
Cook Jammie W
Purchase Details
Closed on
Oct 4, 1971
Sold by
Davis Clyde R Bldrs
Bought by
Fowler James F and Fowler Ann W
Purchase Details
Closed on
Mar 26, 1970
Bought by
Davis Clyde R Bldrs
Create a Home Valuation Report for This Property
The Home Valuation Report is an in-depth analysis detailing your home's value as well as a comparison with similar homes in the area
Home Values in the Area
Average Home Value in this Area
Purchase History
| Date | Buyer | Sale Price | Title Company |
|---|---|---|---|
| Hardin Robert | $255,000 | -- | |
| Beehive Homes Llc | $122,500 | -- | |
| Cook Doris Anita | -- | -- | |
| Cook Jammie W | -- | -- | |
| Cook Jammie W | $8,700 | -- | |
| Fowler James F | $31,300 | -- | |
| Davis Clyde R Bldrs | -- | -- |
Source: Public Records
Mortgage History
| Date | Status | Borrower | Loan Amount |
|---|---|---|---|
| Open | Hardin Robert | $250,381 |
Source: Public Records
Tax History Compared to Growth
Tax History
| Year | Tax Paid | Tax Assessment Tax Assessment Total Assessment is a certain percentage of the fair market value that is determined by local assessors to be the total taxable value of land and additions on the property. | Land | Improvement |
|---|---|---|---|---|
| 2024 | $5,969 | $155,896 | $13,640 | $142,256 |
| 2023 | $5,521 | $150,468 | $12,320 | $138,148 |
| 2022 | $3,941 | $107,996 | $10,120 | $97,876 |
| 2021 | $3,663 | $98,717 | $10,120 | $88,597 |
| 2020 | $1,198 | $60,250 | $7,700 | $52,550 |
| 2019 | $1,150 | $58,415 | $7,700 | $50,715 |
| 2018 | $1,117 | $56,504 | $7,700 | $48,804 |
| 2017 | $1,072 | $53,919 | $7,700 | $46,219 |
| 2016 | $1,070 | $53,552 | $7,680 | $45,872 |
| 2015 | -- | $54,352 | $7,680 | $46,672 |
| 2014 | -- | $54,485 | $7,680 | $46,805 |
Source: Public Records
Map
Nearby Homes
- 10 Thornwood Dr SW
- 203 Hycliff Rd SW
- 106 Kenwood Dr SW
- 8 Bush Arbor Place SW
- 10 Bush Arbor Place SW
- 120 Thornwood Dr SW
- 125 Thornwood Dr SW
- 15 Ladonna Place SW
- 30 Westover Dr SW
- 9 Ladonna Place SW
- The Foxcroft Plan at North Haven
- The McGinnis Plan at North Haven
- The Caldwell Plan at North Haven
- The Bradley Plan at North Haven
- The Pearson Plan at North Haven
- The Coleman Plan at North Haven
- The Grayson Plan at North Haven
- The Benson II Plan at North Haven
- 2604 Shorter Ave NW
- 23 Berryrun Dr SW
- 118 Hycliff Rd SW
- 116 Hycliff Rd SW
- 120 Hycliff Rd SW
- 114 Hycliff Rd SW
- 117 Hycliff Rd SW Unit 12
- 117 Hycliff Rd SW
- 115 Hycliff Rd SW
- 122 Hycliff Rd SW
- 119 Hycliff Rd SW
- 113 Hycliff Rd SW
- 124 Hycliff Rd SW Unit 43
- 124 Hycliff Rd SW
- 112 Hycliff Rd SW
- 14 Thornwood Dr SW
- 12 Thornwood Dr SW
- 16 Thornwood Dr SW
- 111 Hycliff Rd SW
- 3 Elmwood Dr SW
- 8 Thornwood Dr SW
- 201 Hycliff Rd SW Unit 37