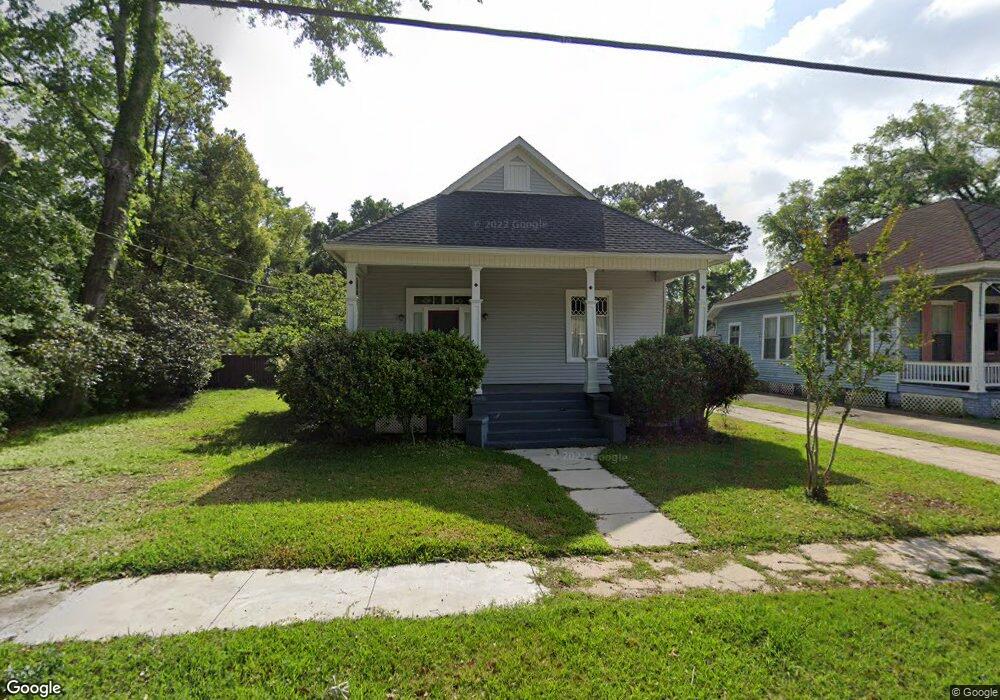
118 Hyland Ave Mobile, AL 36607
Midtown Mobile NeighborhoodEstimated Value: $156,000 - $233,000
3
Beds
1
Bath
1,200
Sq Ft
$157/Sq Ft
Est. Value
About This Home
This home is located at 118 Hyland Ave, Mobile, AL 36607 and is currently estimated at $187,998, approximately $156 per square foot. 118 Hyland Ave is a home located in Mobile County with nearby schools including Westlawn Elementary School, Booker T. Washington Middle School, and Murphy High School.
Ownership History
Date
Name
Owned For
Owner Type
Purchase Details
Closed on
Jan 7, 2016
Sold by
Ward John Kelly
Bought by
Ward John Kelly and Kaska Beth A
Current Estimated Value
Home Financials for this Owner
Home Financials are based on the most recent Mortgage that was taken out on this home.
Original Mortgage
$89,212
Outstanding Balance
$37,912
Interest Rate
3.96%
Mortgage Type
New Conventional
Estimated Equity
$150,086
Purchase Details
Closed on
Aug 26, 2009
Sold by
Chauffe Jeanne Louise and Ward John Kelly
Bought by
Ward John Kelly
Purchase Details
Closed on
Jul 15, 2005
Sold by
Universal Marine Services Inc
Bought by
Ward John Kelly and Chauffe Jeanne Louise
Home Financials for this Owner
Home Financials are based on the most recent Mortgage that was taken out on this home.
Original Mortgage
$71,999
Interest Rate
5.37%
Mortgage Type
Fannie Mae Freddie Mac
Create a Home Valuation Report for This Property
The Home Valuation Report is an in-depth analysis detailing your home's value as well as a comparison with similar homes in the area
Home Values in the Area
Average Home Value in this Area
Purchase History
| Date | Buyer | Sale Price | Title Company |
|---|---|---|---|
| Ward John Kelly | -- | None Available | |
| Ward John Kelly | -- | None Available | |
| Ward John Kelly | $82,000 | -- |
Source: Public Records
Mortgage History
| Date | Status | Borrower | Loan Amount |
|---|---|---|---|
| Open | Ward John Kelly | $89,212 | |
| Previous Owner | Ward John Kelly | $71,999 |
Source: Public Records
Tax History Compared to Growth
Tax History
| Year | Tax Paid | Tax Assessment Tax Assessment Total Assessment is a certain percentage of the fair market value that is determined by local assessors to be the total taxable value of land and additions on the property. | Land | Improvement |
|---|---|---|---|---|
| 2024 | $691 | $11,630 | $1,600 | $10,030 |
| 2023 | $682 | $11,600 | $1,880 | $9,720 |
| 2022 | $676 | $11,700 | $1,880 | $9,820 |
| 2021 | $687 | $11,870 | $1,880 | $9,990 |
| 2020 | $642 | $11,140 | $1,880 | $9,260 |
| 2019 | $666 | $11,540 | $0 | $0 |
| 2018 | $666 | $11,540 | $0 | $0 |
| 2017 | $673 | $11,660 | $0 | $0 |
| 2016 | $715 | $12,320 | $0 | $0 |
| 2013 | $670 | $11,400 | $0 | $0 |
Source: Public Records
Map
Nearby Homes
- 137 Item Ave
- 2557 Springhill Ave
- 161 State St
- 2610 Springhill Ave
- 2514 Springhill Ave
- 260 Siena Vista St
- 2551 Kossow St
- 2405 Springhill Ave
- 2753 Dauphin St
- 2356 Old Shell Rd
- 306 Levert St
- 211 Lanier Ave
- 272 Burton Ave
- 8 Elizabeth Place
- 361 Fredonia St
- 32 Sherwood Dr
- 25 W Chadwick Dr
- 62 Macks St
- 114 Union Ave
- 51 Macks St
- 116 Hyland Ave
- 114 Hyland Ave
- 124 Hyland Ave
- 112 Hyland Ave
- 117 Hyland Ave
- 126 Hyland Ave
- 110 Hyland Ave
- 128 Hyland Ave
- 121 Hyland Ave
- 115 Hyland Ave
- 113 Hyland Ave
- 130 Hyland Ave
- 130 Hyland Ave
- 130 Hyland Ave Unit 1/2
- 125 Hyland Ave
- 123 Item Ave
- 129 Hyland Ave
- 121 Item Ave
- 125 Item Ave
- 119 Item Ave