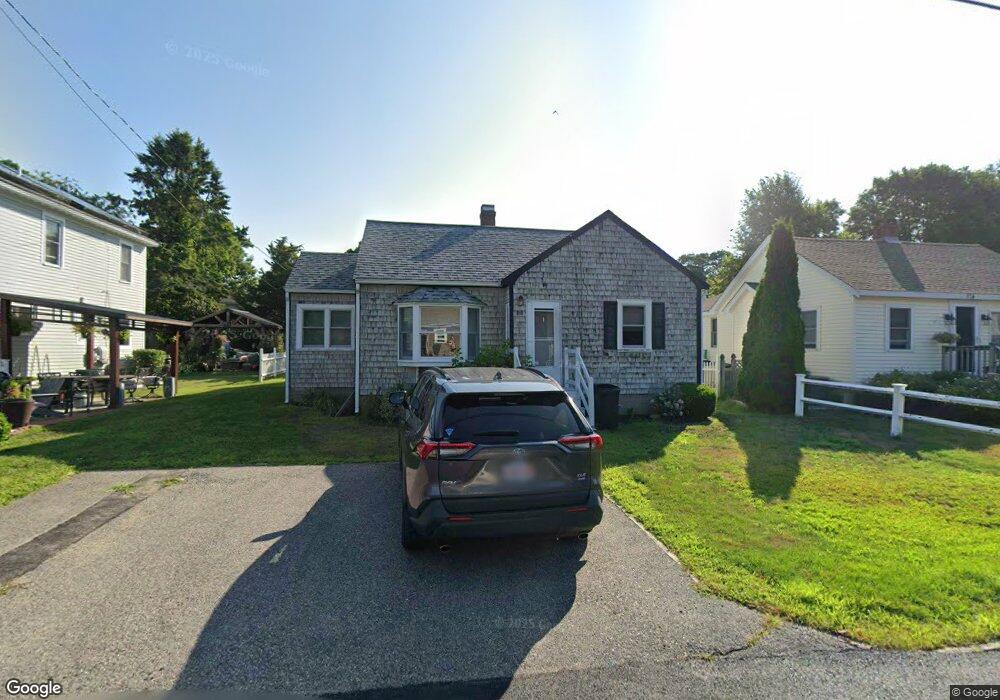
118 June St Marshfield, MA 02050
Ocean Bluff-Brant Rock NeighborhoodEstimated Value: $468,000 - $597,000
2
Beds
1
Bath
1,158
Sq Ft
$481/Sq Ft
Est. Value
About This Home
This home is located at 118 June St, Marshfield, MA 02050 and is currently estimated at $557,079, approximately $481 per square foot. 118 June St is a home located in Plymouth County with nearby schools including Governor Edward Winslow School, Furnace Brook Middle School, and Marshfield High School.
Ownership History
Date
Name
Owned For
Owner Type
Purchase Details
Closed on
Jan 26, 2018
Sold by
Sylvia James A
Bought by
James A Sylvia Ret
Current Estimated Value
Purchase Details
Closed on
Mar 24, 2016
Sold by
Burke Carol J Est and Burke
Bought by
Sylvia James A
Home Financials for this Owner
Home Financials are based on the most recent Mortgage that was taken out on this home.
Original Mortgage
$127,000
Interest Rate
3.65%
Mortgage Type
New Conventional
Purchase Details
Closed on
Jul 8, 1999
Sold by
Sullivan Gregg P and Sullivan Brenda A
Bought by
Burke Carol J
Purchase Details
Closed on
Dec 21, 1998
Sold by
Jordan Brian P and Jordan Jean M
Bought by
Sullivan Gregg R and Sullivan Brenda A
Create a Home Valuation Report for This Property
The Home Valuation Report is an in-depth analysis detailing your home's value as well as a comparison with similar homes in the area
Home Values in the Area
Average Home Value in this Area
Purchase History
| Date | Buyer | Sale Price | Title Company |
|---|---|---|---|
| James A Sylvia Ret | -- | -- | |
| James A Sylvia Ret | -- | -- | |
| Sylvia James A | $210,000 | -- | |
| Sylvia James A | $210,000 | -- | |
| Burke Carol J | $159,900 | -- | |
| Burke Carol J | $159,900 | -- | |
| Sullivan Gregg R | $141,000 | -- | |
| Sullivan Gregg R | $141,000 | -- |
Source: Public Records
Mortgage History
| Date | Status | Borrower | Loan Amount |
|---|---|---|---|
| Previous Owner | Sylvia James A | $127,000 | |
| Previous Owner | Sullivan Gregg R | $31,498 |
Source: Public Records
Tax History
| Year | Tax Paid | Tax Assessment Tax Assessment Total Assessment is a certain percentage of the fair market value that is determined by local assessors to be the total taxable value of land and additions on the property. | Land | Improvement |
|---|---|---|---|---|
| 2025 | $5,264 | $531,700 | $317,600 | $214,100 |
| 2024 | $5,114 | $492,200 | $297,800 | $194,400 |
| 2023 | $4,821 | $437,300 | $268,000 | $169,300 |
| 2022 | $4,821 | $372,300 | $228,300 | $144,000 |
| 2021 | $4,576 | $346,900 | $218,400 | $128,500 |
| 2020 | $4,227 | $317,100 | $188,600 | $128,500 |
| 2019 | $4,132 | $308,800 | $188,600 | $120,200 |
| 2018 | $4,050 | $302,900 | $188,600 | $114,300 |
| 2017 | $3,844 | $280,200 | $178,700 | $101,500 |
| 2016 | $3,684 | $265,400 | $168,700 | $96,700 |
| 2015 | $3,527 | $265,400 | $168,700 | $96,700 |
| 2014 | $3,361 | $252,900 | $168,700 | $84,200 |
Source: Public Records
Map
Nearby Homes
- 122 June St
- 78 Tower Ave
- 17 Dyke Rd
- 106 Careswell St
- 116 Island St
- 32 Gratto Rd
- 85 Constitution Rd
- 71 Gurnet Rd
- 116 Outlook Rd
- 30 Chandler Dr
- 42 Carr Rd
- 86 Barouche Dr
- 155 Quincy Ave
- 568 Webster St
- 7 Pierce Rd
- 92 Salt Meadow Waye
- 184 King Phillips Pathe
- 290 S River St
- 431 Moraine St
- 242 Enterprise St
Your Personal Tour Guide
Ask me questions while you tour the home.