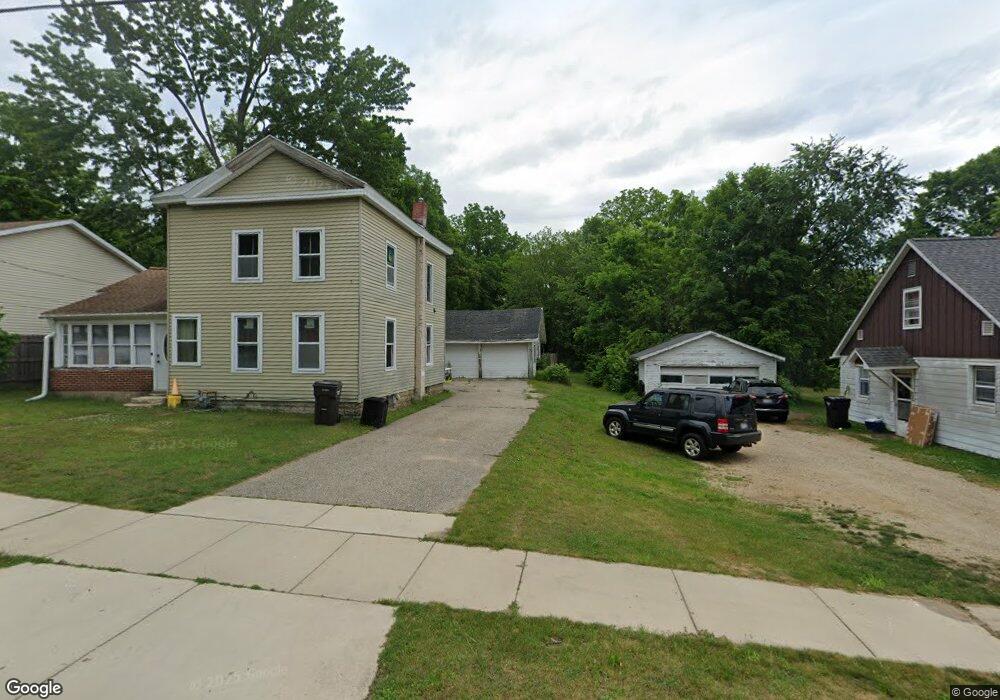
118 Knapp St Allegan, MI 49010
Estimated Value: $175,733 - $220,000
3
Beds
1
Bath
1,400
Sq Ft
$138/Sq Ft
Est. Value
About This Home
This home is located at 118 Knapp St, Allegan, MI 49010 and is currently estimated at $192,933, approximately $137 per square foot. 118 Knapp St is a home located in Allegan County with nearby schools including West Ward Elementary School, L.E. White Middle School, and Allegan High School.
Ownership History
Date
Name
Owned For
Owner Type
Purchase Details
Closed on
Apr 14, 2016
Sold by
Litzenburg Gina R and Litzenburg Dennis R
Bought by
Litzenburg Dennis R
Current Estimated Value
Purchase Details
Closed on
Jul 8, 2011
Sold by
Fannie Mae
Bought by
Litzenburg Dennis and Litzenburg Gina
Purchase Details
Closed on
Oct 7, 2010
Sold by
Davison David W and Davison Deborah Lin M
Bought by
Federal National Mortgage Association
Purchase Details
Closed on
Sep 15, 2005
Sold by
Pettee Michael G and Pettee Carolyn D
Bought by
Davison David W and Davison Deborah Lin M
Home Financials for this Owner
Home Financials are based on the most recent Mortgage that was taken out on this home.
Original Mortgage
$77,775
Interest Rate
11.5%
Mortgage Type
Fannie Mae Freddie Mac
Purchase Details
Closed on
Jul 23, 1997
Sold by
Oetman Rosalie and Oetman Donald
Bought by
Pettee Michael
Create a Home Valuation Report for This Property
The Home Valuation Report is an in-depth analysis detailing your home's value as well as a comparison with similar homes in the area
Home Values in the Area
Average Home Value in this Area
Purchase History
| Date | Buyer | Sale Price | Title Company |
|---|---|---|---|
| Litzenburg Dennis R | -- | None Available | |
| Litzenburg Dennis | $17,000 | Etitle Agency Inc | |
| Federal National Mortgage Association | $94,162 | None Available | |
| Davison David W | $91,500 | Chicago Title | |
| Pettee Michael | $48,000 | -- |
Source: Public Records
Mortgage History
| Date | Status | Borrower | Loan Amount |
|---|---|---|---|
| Previous Owner | Davison David W | $77,775 |
Source: Public Records
Tax History Compared to Growth
Tax History
| Year | Tax Paid | Tax Assessment Tax Assessment Total Assessment is a certain percentage of the fair market value that is determined by local assessors to be the total taxable value of land and additions on the property. | Land | Improvement |
|---|---|---|---|---|
| 2025 | $1,296 | $62,300 | $18,400 | $43,900 |
| 2024 | $1,179 | $60,400 | $17,700 | $42,700 |
| 2023 | $1,222 | $52,500 | $16,600 | $35,900 |
| 2022 | $1,179 | $44,300 | $14,000 | $30,300 |
| 2021 | $1,127 | $40,500 | $11,100 | $29,400 |
| 2020 | $1,111 | $39,500 | $9,200 | $30,300 |
| 2019 | $1,084 | $34,400 | $8,100 | $26,300 |
| 2018 | $1,041 | $30,200 | $7,900 | $22,300 |
| 2017 | $0 | $27,800 | $6,600 | $21,200 |
| 2016 | $0 | $23,200 | $5,500 | $17,700 |
| 2015 | -- | $23,200 | $5,500 | $17,700 |
| 2014 | -- | $24,200 | $5,500 | $18,700 |
| 2013 | $1,404 | $25,200 | $5,500 | $19,700 |
Source: Public Records
Map
Nearby Homes