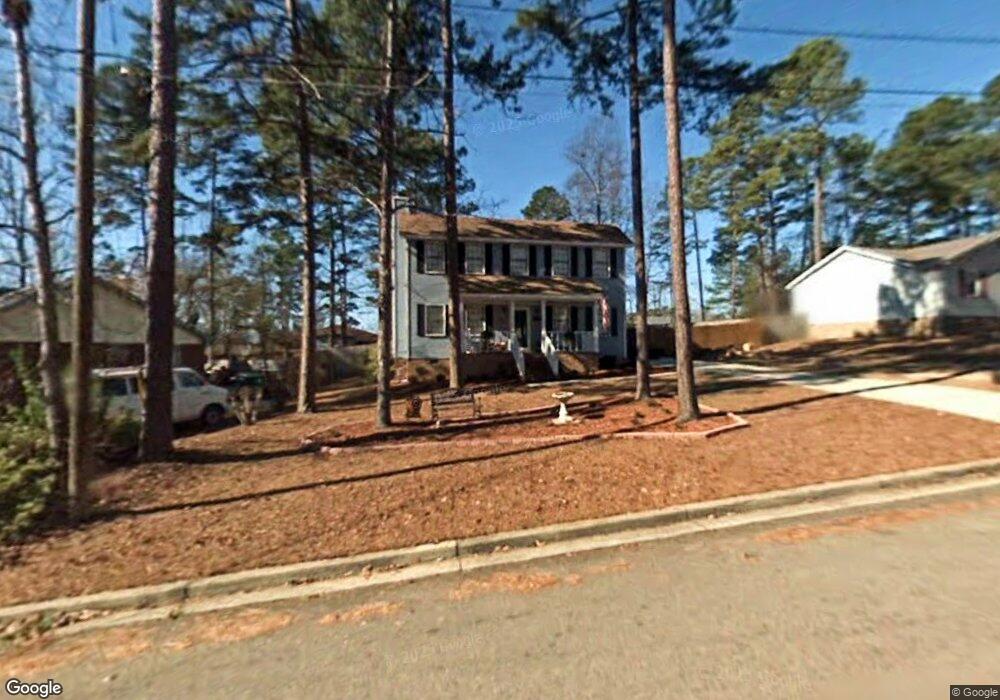
118 Laura Ln Augusta, GA 30907
Estimated Value: $221,455 - $249,000
3
Beds
3
Baths
1,410
Sq Ft
$166/Sq Ft
Est. Value
About This Home
This home is located at 118 Laura Ln, Augusta, GA 30907 and is currently estimated at $233,364, approximately $165 per square foot. 118 Laura Ln is a home located in Columbia County with nearby schools including Westmont Elementary School, Evans Middle School, and NeoCity Academy.
Ownership History
Date
Name
Owned For
Owner Type
Purchase Details
Closed on
Nov 10, 2005
Sold by
Jones William P
Bought by
Jones Sharon Simons
Current Estimated Value
Home Financials for this Owner
Home Financials are based on the most recent Mortgage that was taken out on this home.
Original Mortgage
$90,320
Outstanding Balance
$52,779
Interest Rate
7.25%
Mortgage Type
New Conventional
Estimated Equity
$180,585
Purchase Details
Closed on
Apr 28, 2004
Sold by
Jones William P
Bought by
Jones Sharon Simons
Purchase Details
Closed on
Jan 28, 2004
Sold by
Olson John R and Olson Janice L
Bought by
Jones William P
Home Financials for this Owner
Home Financials are based on the most recent Mortgage that was taken out on this home.
Original Mortgage
$82,766
Interest Rate
5.72%
Mortgage Type
Purchase Money Mortgage
Create a Home Valuation Report for This Property
The Home Valuation Report is an in-depth analysis detailing your home's value as well as a comparison with similar homes in the area
Home Values in the Area
Average Home Value in this Area
Purchase History
| Date | Buyer | Sale Price | Title Company |
|---|---|---|---|
| Jones Sharon Simons | -- | -- | |
| Jones William P | -- | -- | |
| Custer Timothy | $112,900 | -- | |
| Jones Sharon Simons | -- | -- | |
| Jones William P | $82,500 | -- |
Source: Public Records
Mortgage History
| Date | Status | Borrower | Loan Amount |
|---|---|---|---|
| Open | Custer Timothy | $90,320 | |
| Closed | Jones William P | $90,320 | |
| Previous Owner | Jones William P | $82,766 |
Source: Public Records
Tax History Compared to Growth
Tax History
| Year | Tax Paid | Tax Assessment Tax Assessment Total Assessment is a certain percentage of the fair market value that is determined by local assessors to be the total taxable value of land and additions on the property. | Land | Improvement |
|---|---|---|---|---|
| 2025 | $1,974 | $80,299 | $16,804 | $63,495 |
| 2024 | $2,013 | $78,219 | $16,604 | $61,615 |
| 2023 | $2,013 | $80,536 | $16,204 | $64,332 |
| 2022 | $1,897 | $70,747 | $14,104 | $56,643 |
| 2021 | $1,703 | $60,452 | $13,004 | $47,448 |
| 2020 | $1,484 | $51,332 | $11,904 | $39,428 |
| 2019 | $1,431 | $49,428 | $11,904 | $37,524 |
| 2018 | $1,332 | $45,682 | $9,204 | $36,478 |
| 2017 | $1,267 | $43,192 | $8,704 | $34,488 |
| 2016 | $1,257 | $44,449 | $9,480 | $34,969 |
| 2015 | $1,226 | $43,223 | $9,180 | $34,043 |
| 2014 | $1,172 | $40,704 | $7,380 | $33,324 |
Source: Public Records
Map
Nearby Homes
- 4621 Durbin Dr
- 4442 Roxbury Dr
- 213 N Belair Rd
- 4521 Zola Dr
- 4558 Glenda Ln
- 4009 Waccamaw Dr
- 126 Moss Creek Dr
- 245 Belair Rd N
- 4517 Glennwood Dr
- 4425 Branchwood Dr
- 133 Highview Dr
- 104 Moss Creek Dr
- 231 Dry Creek Rd
- 217 Dry Creek Rd
- 103 Dresden Dr
- 249 Ashbrook Dr
- 336 Crooked Pine Dr
- 4750 Maple Spring Ct
- 125 Sugar Maple Ln
- 174 Creek View Ct
- 120 Laura Ln
- 116 Laura Ln
- 4601 Renee St
- 4601 Renee St Unit B
- 4601 Renee St Unit A
- 114 Laura Ln
- 122 Laura Ln
- 129 Stoneybrooks Place
- 117 Laura Ln
- 119 Laura Ln
- 4603 Renee St
- 131 Stoneybrooks Place
- 121 Laura Ln
- 4602 Renee St
- 4598 Renee Ct
- 124 Laura Ln
- 4594 Renee Ct
- 4596 Renee Ct
- 133 Stoneybrooks Place Unit B
- 133 Stoneybrooks Place