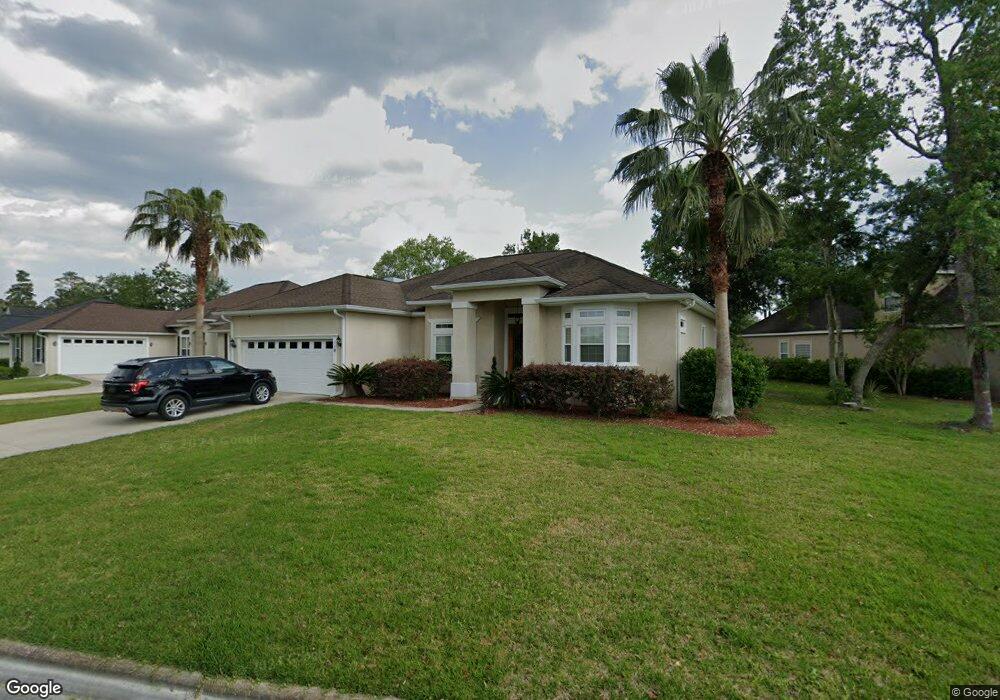
118 Laurel Marsh Way Kingsland, GA 31548
Estimated Value: $394,186 - $476,000
4
Beds
3
Baths
2,544
Sq Ft
$172/Sq Ft
Est. Value
About This Home
This home is located at 118 Laurel Marsh Way, Kingsland, GA 31548 and is currently estimated at $436,297, approximately $171 per square foot. 118 Laurel Marsh Way is a home located in Camden County with nearby schools including Sugarmill Elementary School, Saint Marys Middle School, and Camden County High School.
Ownership History
Date
Name
Owned For
Owner Type
Purchase Details
Closed on
Sep 30, 2022
Sold by
Fils Aime Lionel
Bought by
Fils Aime Denise
Current Estimated Value
Purchase Details
Closed on
Oct 29, 2019
Sold by
Coons Denise B
Bought by
Fils and Aime Denise
Purchase Details
Closed on
Dec 5, 2006
Sold by
Not Provided
Bought by
Coons Denise B
Home Financials for this Owner
Home Financials are based on the most recent Mortgage that was taken out on this home.
Original Mortgage
$294,800
Interest Rate
7.5%
Mortgage Type
New Conventional
Purchase Details
Closed on
Mar 3, 2006
Sold by
Not Provided
Bought by
Coons Denise B
Home Financials for this Owner
Home Financials are based on the most recent Mortgage that was taken out on this home.
Original Mortgage
$294,063
Interest Rate
6.19%
Mortgage Type
New Conventional
Create a Home Valuation Report for This Property
The Home Valuation Report is an in-depth analysis detailing your home's value as well as a comparison with similar homes in the area
Home Values in the Area
Average Home Value in this Area
Purchase History
| Date | Buyer | Sale Price | Title Company |
|---|---|---|---|
| Fils Aime Denise | -- | -- | |
| Fils | -- | -- | |
| Coons Denise B | $368,500 | -- | |
| Coons Denise B | $87,900 | -- |
Source: Public Records
Mortgage History
| Date | Status | Borrower | Loan Amount |
|---|---|---|---|
| Previous Owner | Coons Denise B | $294,800 | |
| Previous Owner | Coons Denise B | $73,700 | |
| Previous Owner | Coons Denise B | $294,063 |
Source: Public Records
Tax History Compared to Growth
Tax History
| Year | Tax Paid | Tax Assessment Tax Assessment Total Assessment is a certain percentage of the fair market value that is determined by local assessors to be the total taxable value of land and additions on the property. | Land | Improvement |
|---|---|---|---|---|
| 2025 | $2,854 | $136,030 | $14,000 | $122,030 |
| 2024 | $3,008 | $133,638 | $14,000 | $119,638 |
| 2023 | $3,110 | $129,638 | $10,000 | $119,638 |
| 2022 | $2,902 | $123,951 | $10,000 | $113,951 |
| 2021 | $2,997 | $107,196 | $10,000 | $97,196 |
| 2020 | $3,073 | $102,236 | $12,000 | $90,236 |
| 2019 | $3,611 | $102,236 | $12,000 | $90,236 |
| 2018 | $832 | $102,236 | $12,000 | $90,236 |
| 2017 | $3,435 | $94,337 | $12,000 | $82,337 |
| 2016 | $2,631 | $91,868 | $12,000 | $79,868 |
| 2015 | $3,282 | $91,868 | $12,000 | $79,868 |
| 2014 | $3,271 | $91,868 | $12,000 | $79,868 |
Source: Public Records
Map
Nearby Homes
- 112 Justin Cole Dr
- 102 Herons Nest Cir
- 103 Renee Dr
- 151 Laurel Marsh Way
- 107 Amanda Trc
- 134 Bryce Ryan Cir
- 136 Bryce Ryan Cir
- 125 Fiddlers Cove Dr
- 121 Amanda Trace
- 204 Laurel Landing Blvd
- 133 Amanda Trace
- 137 Amanda Trace
- 131 Amanda Trc
- 132 Brookshire Green Ct
- 215 Austin Ryan Dr
- Huntington Plan at Brookshire Green
- Memphis Plan at Brookshire Green
- Harmony Plan at Brookshire Green
- Wilmington Plan at Brookshire Green
- Drexel Plan at Brookshire Green
- 120 Laurel Marsh Way
- 120 Laurel Marsh Way
- 1 Tidewater Cir
- 116 Laurel Marsh Way
- 114 Laurel Marsh Way
- 01 Tidewater Cir
- 122 Laurel Marsh Way
- 0 Tidewater Cir Unit 8384278
- 0 Tidewater Cir Unit 15 8192440
- 0 Tidewater Cir Unit 16 8192417
- 0 Tidewater Cir Unit 10099165
- 0 Tidewater Cir Unit 10080971
- 0 Tidewater Cir Unit 8544061
- 100 Tidewater Cir
- 119 Laurel Marsh Way
- 119 Laurel Marsh Way
- 101 Tidewater Cir
- 112 Laurel Marsh Way
- 124 Laurel Marsh Way
- 113 Laurel Marsh Way