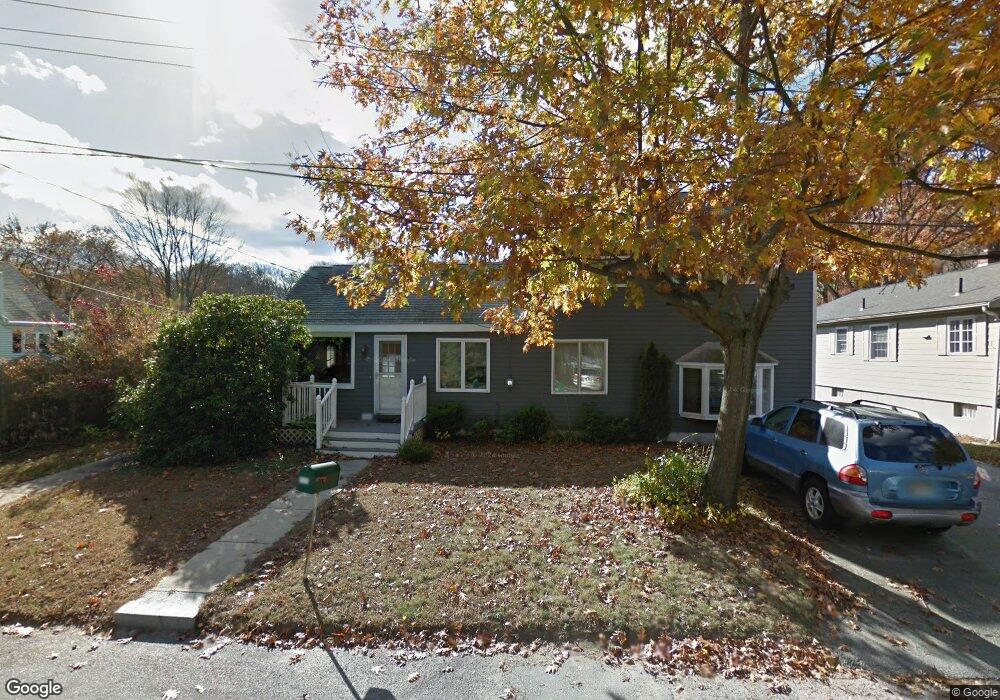
118 Libby Ave Reading, MA 01867
Estimated Value: $756,709 - $827,000
3
Beds
2
Baths
1,792
Sq Ft
$445/Sq Ft
Est. Value
About This Home
This home is located at 118 Libby Ave, Reading, MA 01867 and is currently estimated at $797,927, approximately $445 per square foot. 118 Libby Ave is a home located in Middlesex County with nearby schools including J. Warren Killam Elementary School, Walter S. Parker Middle School, and Reading Memorial High School.
Ownership History
Date
Name
Owned For
Owner Type
Purchase Details
Closed on
Mar 15, 2001
Sold by
Gray Robert B and Bourgault Paula A
Bought by
Engel Stewart A
Current Estimated Value
Home Financials for this Owner
Home Financials are based on the most recent Mortgage that was taken out on this home.
Original Mortgage
$162,000
Outstanding Balance
$58,945
Interest Rate
7.01%
Mortgage Type
Purchase Money Mortgage
Estimated Equity
$738,982
Purchase Details
Closed on
Feb 1, 1993
Sold by
Johnson Albert F and Johnson Sandra L
Bought by
Gray Robert B and Bourgault Paula A
Home Financials for this Owner
Home Financials are based on the most recent Mortgage that was taken out on this home.
Original Mortgage
$165,200
Interest Rate
8.16%
Mortgage Type
Purchase Money Mortgage
Create a Home Valuation Report for This Property
The Home Valuation Report is an in-depth analysis detailing your home's value as well as a comparison with similar homes in the area
Home Values in the Area
Average Home Value in this Area
Purchase History
| Date | Buyer | Sale Price | Title Company |
|---|---|---|---|
| Engel Stewart A | $292,500 | -- | |
| Gray Robert B | $180,000 | -- |
Source: Public Records
Mortgage History
| Date | Status | Borrower | Loan Amount |
|---|---|---|---|
| Open | Engel Stewart A | $162,000 | |
| Previous Owner | Engel Stewart A | $150,000 | |
| Previous Owner | Engel Stewart A | $158,800 | |
| Previous Owner | Gray Robert B | $165,200 |
Source: Public Records
Tax History
| Year | Tax Paid | Tax Assessment Tax Assessment Total Assessment is a certain percentage of the fair market value that is determined by local assessors to be the total taxable value of land and additions on the property. | Land | Improvement |
|---|---|---|---|---|
| 2025 | $7,991 | $701,600 | $414,300 | $287,300 |
| 2024 | $7,754 | $661,600 | $390,700 | $270,900 |
| 2023 | $7,934 | $630,200 | $372,100 | $258,100 |
| 2022 | $7,637 | $572,900 | $338,200 | $234,700 |
| 2021 | $9,585 | $527,800 | $315,700 | $212,100 |
| 2020 | $6,971 | $499,700 | $298,900 | $200,800 |
| 2019 | $10,228 | $475,900 | $284,600 | $191,300 |
| 2018 | $10,278 | $452,200 | $270,400 | $181,800 |
| 2017 | $6,514 | $464,300 | $258,800 | $205,500 |
| 2016 | $5,751 | $396,600 | $212,600 | $184,000 |
| 2015 | $5,552 | $377,700 | $202,400 | $175,300 |
| 2014 | $5,303 | $359,800 | $192,800 | $167,000 |
Source: Public Records
Map
Nearby Homes
- 41 Winter St
- 103 Orange St
- 24 Smith Ave
- 3 Carnation Cir Unit C
- 863 Main St
- 0 Charles St Unit 72374573
- 48 Village St Unit 1001
- 35 Longfellow Rd
- 50 Quannapowitt Pkwy
- 69 Ash St
- 43 Ashley Place
- 89 Grand St
- 115 Forest St
- 5 Washington St Unit D4
- 159 Main St
- 16 Beebe Ln
- 119 Van Norden Rd
- 12 Heritage Ln
- 20 Pinevale Ave
- 241 Main St Unit C3
Your Personal Tour Guide
Ask me questions while you tour the home.