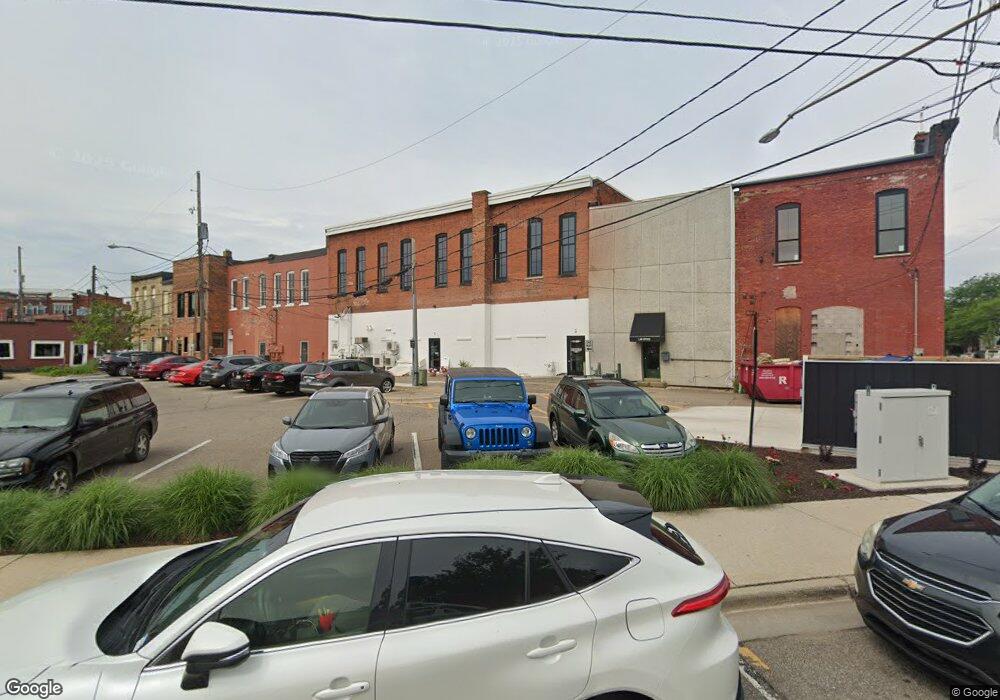
118 Locust St Allegan, MI 49010
Estimated Value: $392,810
--
Bed
1
Bath
10,950
Sq Ft
$36/Sq Ft
Est. Value
About This Home
This home is located at 118 Locust St, Allegan, MI 49010 and is currently estimated at $392,810, approximately $35 per square foot. 118 Locust St is a home located in Allegan County with nearby schools including North Ward Elementary School, L.E. White Middle School, and Allegan High School.
Ownership History
Date
Name
Owned For
Owner Type
Purchase Details
Closed on
Nov 17, 2017
Sold by
Howelll Matthew and Miersma Michelle
Bought by
Lumbermans Lofff Llc
Current Estimated Value
Purchase Details
Closed on
Oct 14, 2013
Sold by
Carns Bruce R and Carns Ruth Ann
Bought by
The Bruce Roger Carns & Ruth Ann Carns F
Purchase Details
Closed on
Jan 11, 1988
Purchase Details
Closed on
Jan 1, 1988
Create a Home Valuation Report for This Property
The Home Valuation Report is an in-depth analysis detailing your home's value as well as a comparison with similar homes in the area
Home Values in the Area
Average Home Value in this Area
Purchase History
| Date | Buyer | Sale Price | Title Company |
|---|---|---|---|
| Lumbermans Lofff Llc | -- | None Available | |
| Howell Mattthew | -- | None Available | |
| The Bruce Roger Carns & Ruth Ann Carns F | -- | None Available | |
| -- | $101,200 | -- | |
| -- | $101,200 | -- |
Source: Public Records
Tax History Compared to Growth
Tax History
| Year | Tax Paid | Tax Assessment Tax Assessment Total Assessment is a certain percentage of the fair market value that is determined by local assessors to be the total taxable value of land and additions on the property. | Land | Improvement |
|---|---|---|---|---|
| 2025 | $589 | $16,100 | $16,100 | $0 |
| 2024 | $535 | $16,600 | $16,600 | $0 |
| 2023 | $553 | $14,100 | $14,100 | $0 |
| 2022 | $535 | $10,200 | $10,200 | $0 |
| 2021 | $514 | $8,200 | $8,200 | $0 |
| 2020 | $576 | $9,200 | $9,200 | $0 |
| 2019 | $829 | $13,300 | $13,300 | $0 |
| 2018 | $2,028 | $13,300 | $13,300 | $0 |
| 2017 | $0 | $70,700 | $14,700 | $56,000 |
| 2016 | $0 | $73,400 | $12,800 | $60,600 |
| 2015 | -- | $73,400 | $12,800 | $60,600 |
| 2014 | -- | $82,200 | $12,800 | $69,400 |
| 2013 | $4,522 | $81,500 | $9,200 | $72,300 |
Source: Public Records
Map
Nearby Homes