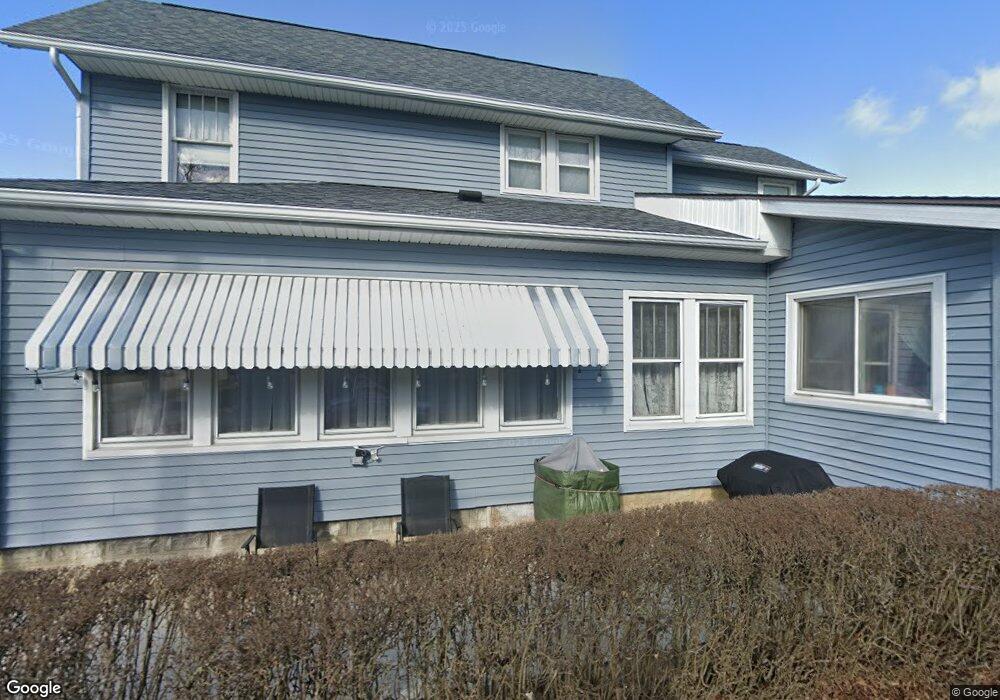
118 Locust St Findlay, OH 45840
Estimated Value: $237,000 - $271,000
4
Beds
4
Baths
1,999
Sq Ft
$131/Sq Ft
Est. Value
About This Home
This home is located at 118 Locust St, Findlay, OH 45840 and is currently estimated at $261,263, approximately $130 per square foot. 118 Locust St is a home located in Hancock County with nearby schools including Lincoln Elementary School, Donnell Middle School, and Findlay High School.
Ownership History
Date
Name
Owned For
Owner Type
Purchase Details
Closed on
Feb 16, 1994
Bought by
Maurer Charles E and Maurer Melody
Current Estimated Value
Purchase Details
Closed on
Jul 12, 1991
Bought by
Bonnell Dorothy M
Purchase Details
Closed on
Mar 29, 1985
Bought by
Hindall Karen Sue
Create a Home Valuation Report for This Property
The Home Valuation Report is an in-depth analysis detailing your home's value as well as a comparison with similar homes in the area
Home Values in the Area
Average Home Value in this Area
Purchase History
| Date | Buyer | Sale Price | Title Company |
|---|---|---|---|
| Maurer Charles E | $84,000 | -- | |
| Bonnell Dorothy M | $71,000 | -- | |
| Hindall Karen Sue | -- | -- |
Source: Public Records
Tax History Compared to Growth
Tax History
| Year | Tax Paid | Tax Assessment Tax Assessment Total Assessment is a certain percentage of the fair market value that is determined by local assessors to be the total taxable value of land and additions on the property. | Land | Improvement |
|---|---|---|---|---|
| 2024 | $2,515 | $70,810 | $7,670 | $63,140 |
| 2023 | $2,519 | $70,810 | $7,670 | $63,140 |
| 2022 | $2,510 | $70,810 | $7,670 | $63,140 |
| 2021 | $2,018 | $49,580 | $7,850 | $41,730 |
| 2020 | $2,018 | $49,580 | $7,850 | $41,730 |
| 2019 | $1,977 | $49,580 | $7,850 | $41,730 |
| 2018 | $1,850 | $42,530 | $5,530 | $37,000 |
| 2017 | $925 | $42,530 | $5,530 | $37,000 |
| 2016 | $1,826 | $42,530 | $5,530 | $37,000 |
| 2015 | $1,153 | $26,380 | $5,530 | $20,850 |
| 2014 | $1,154 | $26,380 | $5,530 | $20,850 |
| 2012 | $1,045 | $23,660 | $5,530 | $18,130 |
Source: Public Records
Map
Nearby Homes