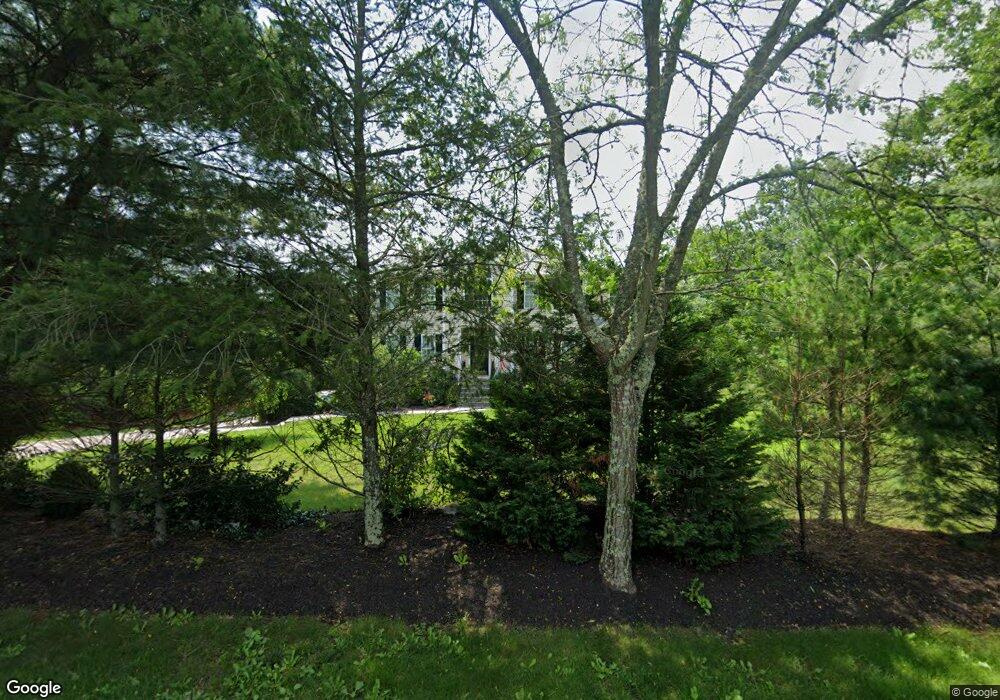
118 Locust St Swansea, MA 02777
West Swansea NeighborhoodEstimated Value: $685,000 - $899,000
3
Beds
3
Baths
2,516
Sq Ft
$303/Sq Ft
Est. Value
About This Home
This home is located at 118 Locust St, Swansea, MA 02777 and is currently estimated at $761,921, approximately $302 per square foot. 118 Locust St is a home located in Bristol County with nearby schools including Joseph Case High School, Swansea Wood School, and SCEC Life Academy.
Ownership History
Date
Name
Owned For
Owner Type
Purchase Details
Closed on
Mar 22, 2002
Sold by
Cedar Ridge Rt and Shahdan Derek P
Bought by
Racine Daniel S and Racine Brendalee
Current Estimated Value
Purchase Details
Closed on
Jun 15, 2001
Sold by
Mcgovern Hugh and Pollock Ronald E
Bought by
Cedar Ridge Rt and Shahdan Derek P
Create a Home Valuation Report for This Property
The Home Valuation Report is an in-depth analysis detailing your home's value as well as a comparison with similar homes in the area
Home Values in the Area
Average Home Value in this Area
Purchase History
| Date | Buyer | Sale Price | Title Company |
|---|---|---|---|
| Racine Daniel S | $270,000 | -- | |
| Cedar Ridge Rt | $67,500 | -- |
Source: Public Records
Mortgage History
| Date | Status | Borrower | Loan Amount |
|---|---|---|---|
| Open | Cedar Ridge Rt | $278,000 | |
| Closed | Cedar Ridge Rt | $186,550 | |
| Closed | Cedar Ridge Rt | $65,000 |
Source: Public Records
Tax History Compared to Growth
Tax History
| Year | Tax Paid | Tax Assessment Tax Assessment Total Assessment is a certain percentage of the fair market value that is determined by local assessors to be the total taxable value of land and additions on the property. | Land | Improvement |
|---|---|---|---|---|
| 2025 | $7,152 | $600,000 | $176,000 | $424,000 |
| 2024 | $7,146 | $596,000 | $176,000 | $420,000 |
| 2023 | $6,356 | $484,100 | $128,700 | $355,400 |
| 2022 | $5,913 | $410,900 | $117,000 | $293,900 |
| 2021 | $5,888 | $376,700 | $117,000 | $259,700 |
| 2020 | $5,959 | $382,500 | $117,000 | $265,500 |
| 2019 | $5,970 | $384,900 | $104,400 | $280,500 |
| 2018 | $5,808 | $380,100 | $102,700 | $277,400 |
| 2017 | $5,009 | $377,200 | $102,700 | $274,500 |
| 2016 | $4,783 | $353,800 | $88,400 | $265,400 |
| 2015 | $4,639 | $353,300 | $88,400 | $264,900 |
| 2014 | $3,830 | $298,300 | $88,400 | $209,900 |
Source: Public Records
Map
Nearby Homes
- 0 Hornbine Rd
- 850 Hortonville Rd
- 203 Hornbine Rd
- 51 Sophia Dr
- 50 Sophia Dr
- 49 Sophia Dr
- 0B Cummings Rd
- 0A Cummings Rd
- 47 Spring St
- 490 Dillon Ln
- 4 Meadowbrook Ave
- 283 Plain St
- 16 Ashlynn Way
- Lot 11 Lynch
- 0 Proprietors Way Unit 73324662
- Lot 10 Lynch
- 16 Martin St
- 194 Hortonville Rd
- 7 Johnnies Way
- 3 Johnnies Way