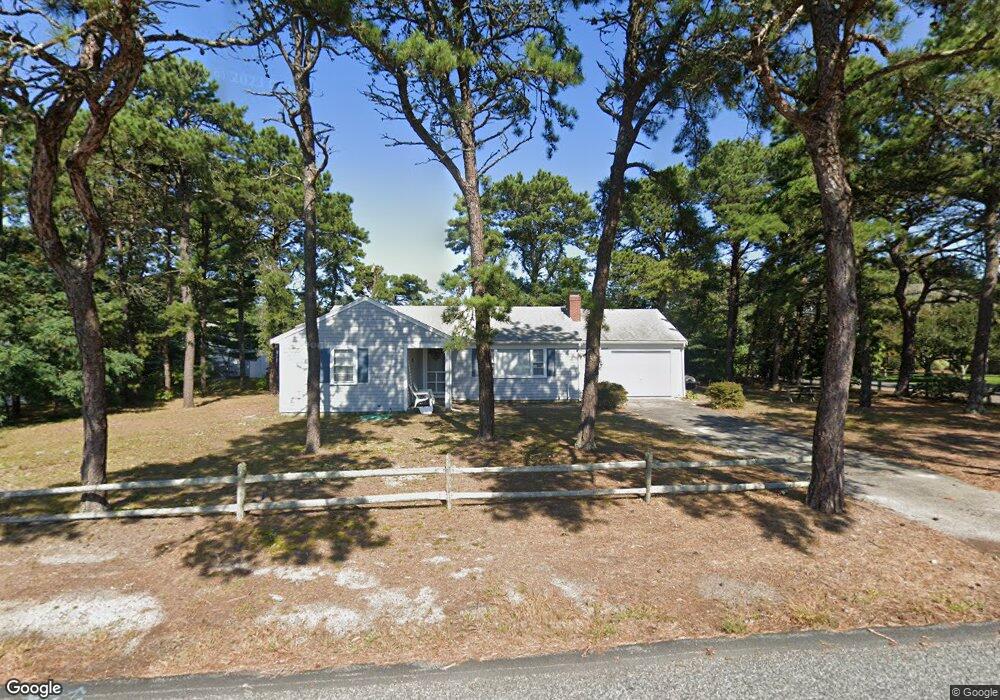
118 Loring Ave West Dennis, MA 02670
West Dennis NeighborhoodEstimated Value: $530,000 - $744,000
2
Beds
1
Bath
1,092
Sq Ft
$583/Sq Ft
Est. Value
About This Home
This home is located at 118 Loring Ave, West Dennis, MA 02670 and is currently estimated at $637,080, approximately $583 per square foot. 118 Loring Ave is a home located in Barnstable County with nearby schools including Dennis-Yarmouth Regional High School and St. Pius X. School.
Ownership History
Date
Name
Owned For
Owner Type
Purchase Details
Closed on
Apr 10, 2023
Sold by
Campbell Sophia M
Bought by
Sophia M Campbell Irt and Kruh
Current Estimated Value
Purchase Details
Closed on
Dec 21, 2017
Sold by
Kathiryn Milio Irt and Campbell
Bought by
Campbell Sophia M
Purchase Details
Closed on
Dec 20, 2012
Sold by
Milio Kathryn L and Milio Labovites A
Bought by
Kathryn Milio Irt and Campbell
Purchase Details
Closed on
Sep 7, 1983
Bought by
Kathrytn Milio Irt
Create a Home Valuation Report for This Property
The Home Valuation Report is an in-depth analysis detailing your home's value as well as a comparison with similar homes in the area
Home Values in the Area
Average Home Value in this Area
Purchase History
| Date | Buyer | Sale Price | Title Company |
|---|---|---|---|
| Sophia M Campbell Irt | -- | None Available | |
| Campbell Sophia M | -- | -- | |
| Kathryn Milio Irt | -- | -- | |
| Kathryn Milio Irt | -- | -- | |
| Kathrytn Milio Irt | -- | -- |
Source: Public Records
Tax History Compared to Growth
Tax History
| Year | Tax Paid | Tax Assessment Tax Assessment Total Assessment is a certain percentage of the fair market value that is determined by local assessors to be the total taxable value of land and additions on the property. | Land | Improvement |
|---|---|---|---|---|
| 2025 | $2,392 | $552,500 | $155,600 | $396,900 |
| 2024 | $2,244 | $511,100 | $149,600 | $361,500 |
| 2023 | $2,170 | $464,700 | $136,000 | $328,700 |
| 2022 | $2,108 | $376,400 | $134,800 | $241,600 |
| 2021 | $2,000 | $331,600 | $132,100 | $199,500 |
| 2020 | $1,984 | $325,200 | $144,200 | $181,000 |
| 2019 | $1,792 | $290,400 | $117,800 | $172,600 |
| 2018 | $2,048 | $323,100 | $168,200 | $154,900 |
| 2017 | $1,749 | $284,400 | $134,500 | $149,900 |
| 2016 | $1,816 | $278,100 | $151,400 | $126,700 |
| 2015 | $1,780 | $278,100 | $151,400 | $126,700 |
| 2014 | $1,766 | $278,100 | $151,400 | $126,700 |
Source: Public Records
Map
Nearby Homes
- 2 Rita Mary Way
- 14 Schoolhouse Ln
- 209 Main St Unit 3
- 209 Main St Unit 6
- 209 Main St Unit 1
- 209 Main St Unit 2
- 209 Main St Unit 4
- 209 Main St Unit 5
- 178 School St
- 23 Doric Ave
- 308 Old Main St
- 181 Pleasant St
- 45 Seth Ln
- 40 Kelley Rd
- 401 Main St Unit 201
- 401 Main St Unit 101
- 29 Bass River Rd
- 22 Powhatan Rd
- 467 Main St
- 18 Turner Ln
- 9 Uncle Nicks Rd
- 108 Loring Ave
- 106 Loring Ave
- 126 Loring Ave
- 127 Loring Ave
- 5 Merchant Ave
- 14 Uncle Nick's Rd
- 10 Uncle Nicks Rd
- 14 Uncle Nicks Rd
- 130 Loring Ave
- 7 Kelleys Pond Rd
- 131 Loring Ave
- 4 Santucket Rd
- 2 Kelleys Pond Rd
- 96 Loring Ave
- 6 Kelley's Pond
- 7 Uncle Franks Rd
- 11 Uncle Franks Rd
- 6 Old Field Rd
- 103 Loring Ave