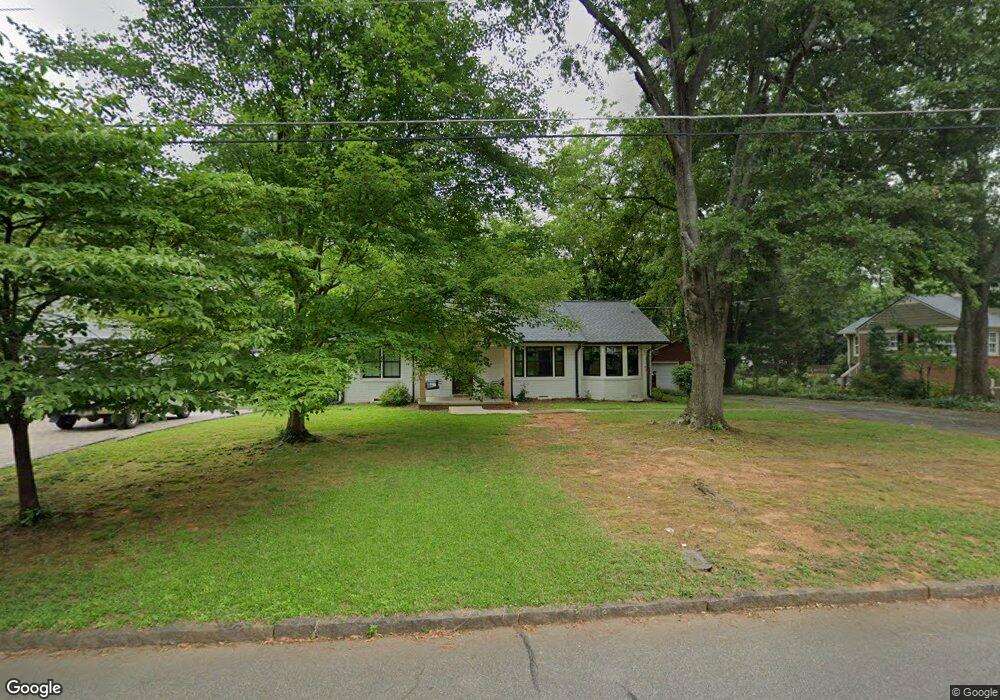
118 Luckie St Cartersville, GA 30120
Estimated Value: $351,000 - $370,000
3
Beds
2
Baths
1,607
Sq Ft
$225/Sq Ft
Est. Value
About This Home
This home is located at 118 Luckie St, Cartersville, GA 30120 and is currently estimated at $361,521, approximately $224 per square foot. 118 Luckie St is a home with nearby schools including Cartersville Primary School, Cartersville Elementary School, and Cartersville Middle School.
Ownership History
Date
Name
Owned For
Owner Type
Purchase Details
Closed on
Sep 30, 2025
Sold by
Benton Darrin Parris
Bought by
Benton Darrin Trust and Benton Darrin Tr
Current Estimated Value
Purchase Details
Closed on
Aug 19, 2019
Sold by
Certain Eugenia J
Bought by
Parris Benton Darrin and Wilkerson Wendy Robin
Home Financials for this Owner
Home Financials are based on the most recent Mortgage that was taken out on this home.
Original Mortgage
$236,000
Interest Rate
3.8%
Mortgage Type
Commercial
Create a Home Valuation Report for This Property
The Home Valuation Report is an in-depth analysis detailing your home's value as well as a comparison with similar homes in the area
Home Values in the Area
Average Home Value in this Area
Purchase History
| Date | Buyer | Sale Price | Title Company |
|---|---|---|---|
| Benton Darrin Trust | -- | -- | |
| Parris Benton Darrin | $178,900 | -- |
Source: Public Records
Mortgage History
| Date | Status | Borrower | Loan Amount |
|---|---|---|---|
| Previous Owner | Parris Benton Darrin | $236,000 |
Source: Public Records
Tax History Compared to Growth
Tax History
| Year | Tax Paid | Tax Assessment Tax Assessment Total Assessment is a certain percentage of the fair market value that is determined by local assessors to be the total taxable value of land and additions on the property. | Land | Improvement |
|---|---|---|---|---|
| 2024 | $2,749 | $128,479 | $30,000 | $98,479 |
| 2023 | $3,220 | $132,418 | $30,000 | $102,418 |
| 2022 | $2,424 | $91,700 | $30,000 | $61,700 |
| 2021 | $1,842 | $67,795 | $24,000 | $43,795 |
| 2020 | $1,920 | $68,038 | $24,000 | $44,038 |
| 2019 | $1,102 | $53,859 | $24,000 | $29,859 |
| 2018 | $917 | $48,195 | $20,000 | $28,195 |
| 2017 | $949 | $48,760 | $18,000 | $30,760 |
| 2016 | $963 | $48,760 | $18,000 | $30,760 |
| 2015 | $837 | $45,920 | $16,000 | $29,920 |
| 2014 | $608 | $38,480 | $12,000 | $26,480 |
| 2013 | -- | $34,360 | $10,000 | $24,360 |
Source: Public Records
Map
Nearby Homes