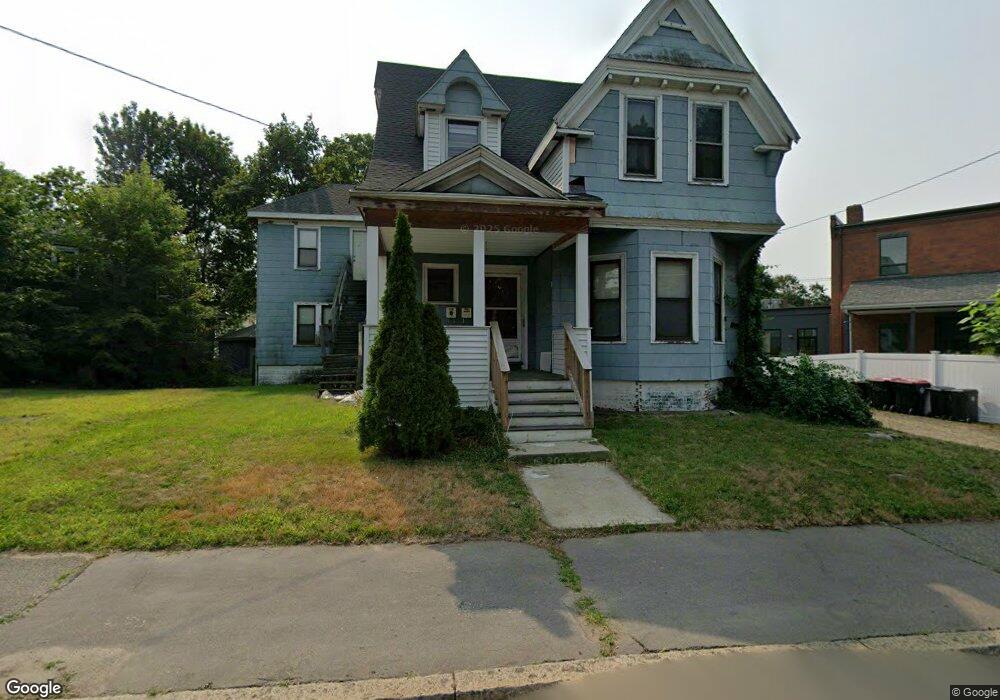
118 Lyman St Brockton, MA 02302
Estimated Value: $636,586 - $774,000
5
Beds
2
Baths
2,863
Sq Ft
$251/Sq Ft
Est. Value
About This Home
This home is located at 118 Lyman St, Brockton, MA 02302 and is currently estimated at $718,147, approximately $250 per square foot. 118 Lyman St is a home located in Plymouth County with nearby schools including Brookfield Elementary School, Downey Elementary School, and Ashfield Middle School.
Ownership History
Date
Name
Owned For
Owner Type
Purchase Details
Closed on
Dec 3, 2009
Sold by
Barclays Capital Re In
Bought by
Allen James H
Current Estimated Value
Purchase Details
Closed on
Jun 30, 2009
Sold by
Dadaille William
Bought by
Wells Fargo Bk
Purchase Details
Closed on
Aug 8, 2008
Sold by
Dadaille William
Bought by
Wells Fargo Bk
Purchase Details
Closed on
Jul 31, 2003
Sold by
Galloway-Cooley Nancy
Bought by
Dadaille William
Home Financials for this Owner
Home Financials are based on the most recent Mortgage that was taken out on this home.
Original Mortgage
$228,000
Interest Rate
5.28%
Mortgage Type
Purchase Money Mortgage
Purchase Details
Closed on
Dec 5, 2000
Sold by
Fuller Rt
Bought by
Galloway-Cooley Nancy
Purchase Details
Closed on
Aug 4, 2000
Sold by
State Street B & T Co
Bought by
Fuller Rt
Purchase Details
Closed on
May 25, 2000
Sold by
Tividor Clarence M
Bought by
State St B & 'T Co Tr
Create a Home Valuation Report for This Property
The Home Valuation Report is an in-depth analysis detailing your home's value as well as a comparison with similar homes in the area
Home Values in the Area
Average Home Value in this Area
Purchase History
| Date | Buyer | Sale Price | Title Company |
|---|---|---|---|
| Allen James H | $65,000 | -- | |
| Wells Fargo Bk | $121,000 | -- | |
| Wells Fargo Bk | $121,000 | -- | |
| Dadaille William | $285,000 | -- | |
| Galloway-Cooley Nancy | $169,900 | -- | |
| Fuller Rt | $70,000 | -- | |
| State St B & 'T Co Tr | $72,000 | -- |
Source: Public Records
Mortgage History
| Date | Status | Borrower | Loan Amount |
|---|---|---|---|
| Previous Owner | State St B & 'T Co Tr | $296,250 | |
| Previous Owner | State St B & 'T Co Tr | $228,000 |
Source: Public Records
Tax History Compared to Growth
Tax History
| Year | Tax Paid | Tax Assessment Tax Assessment Total Assessment is a certain percentage of the fair market value that is determined by local assessors to be the total taxable value of land and additions on the property. | Land | Improvement |
|---|---|---|---|---|
| 2025 | $7,409 | $611,800 | $140,200 | $471,600 |
| 2024 | $6,942 | $577,500 | $140,200 | $437,300 |
| 2023 | $5,970 | $459,900 | $105,100 | $354,800 |
| 2022 | $5,693 | $407,500 | $95,600 | $311,900 |
| 2021 | $5,210 | $359,300 | $79,600 | $279,700 |
| 2020 | $4,106 | $271,000 | $74,300 | $196,700 |
| 2019 | $4,681 | $301,200 | $72,500 | $228,700 |
| 2018 | $4,070 | $253,400 | $72,500 | $180,900 |
| 2017 | $4,180 | $259,600 | $72,500 | $187,100 |
| 2016 | $3,644 | $209,900 | $70,300 | $139,600 |
| 2015 | $3,156 | $173,900 | $70,300 | $103,600 |
| 2014 | $2,848 | $157,100 | $70,300 | $86,800 |
Source: Public Records
Map
Nearby Homes
- 3 Erie Ave
- 336 Crescent St
- 9 Erie Ave
- 342 Crescent St
- 342 Crescent St Unit 2
- 102 Lyman St
- 15 Erie Ave
- 348 Crescent St
- 19 Erie Ave
- 331 Crescent St Unit 2
- 331 Crescent St
- 350 Crescent St
- 350 Crescent St Unit 3
- 350 Crescent St Unit 1
- 350 Crescent St Unit 2
- 329 Crescent St
- 329 Crescent St Unit 2
- 306 Crescent St
- 325 Crescent St
- 337 Crescent St