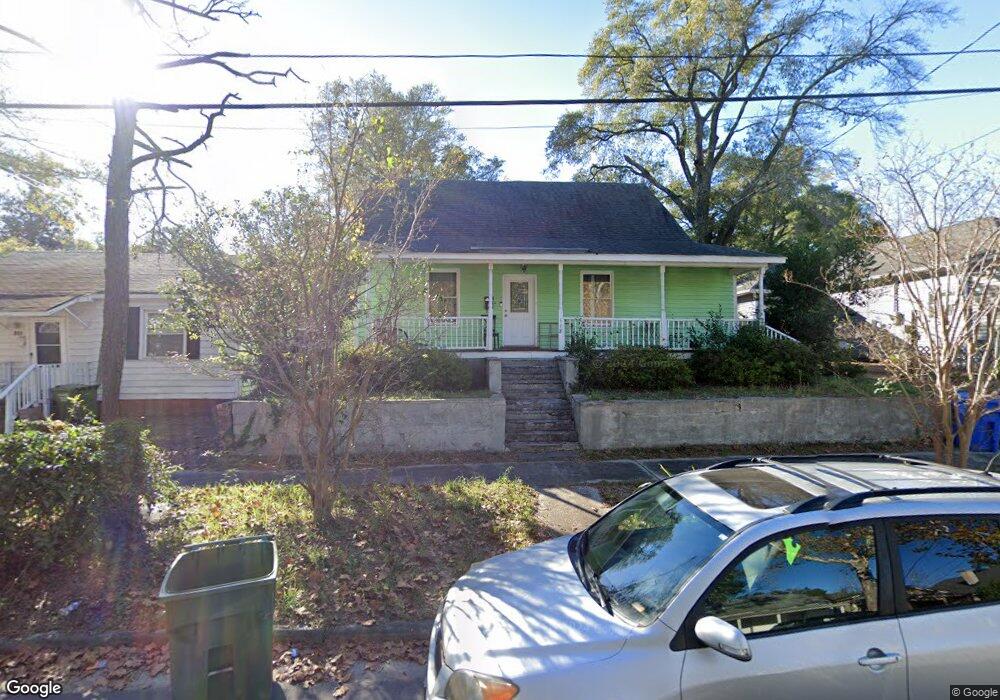
118 Mears St Wilmington, NC 28401
Dry Pond-South Side NeighborhoodEstimated Value: $174,000 - $274,000
3
Beds
2
Baths
1,107
Sq Ft
$196/Sq Ft
Est. Value
About This Home
This home is located at 118 Mears St, Wilmington, NC 28401 and is currently estimated at $216,665, approximately $195 per square foot. 118 Mears St is a home located in New Hanover County with nearby schools including Snipes Academy of Arts & Design, Williston Middle School, and New Hanover High School.
Ownership History
Date
Name
Owned For
Owner Type
Purchase Details
Closed on
Apr 21, 2021
Sold by
Shellhaas Taylor C
Bought by
Wncjre Llc
Current Estimated Value
Purchase Details
Closed on
Jul 8, 2015
Sold by
Perry Janeta A and Hmura Joann
Bought by
Shellhaas Taylor C
Home Financials for this Owner
Home Financials are based on the most recent Mortgage that was taken out on this home.
Original Mortgage
$102,116
Interest Rate
3.87%
Mortgage Type
FHA
Purchase Details
Closed on
Oct 3, 1996
Sold by
Goodman Janie M
Bought by
Perry Janet A
Purchase Details
Closed on
Jul 12, 1993
Sold by
Reynolds Peggy Chestnutt W B
Bought by
Goodman Janie M
Purchase Details
Closed on
May 1, 1987
Sold by
Hunter Jimmy L Patricia S
Bought by
Chestnutt Peggy
Purchase Details
Closed on
Dec 1, 1984
Sold by
Lewis Auto Sales Inc
Bought by
Hunter Jimmy L Patricia S
Purchase Details
Closed on
Jun 1, 1981
Sold by
Yates Faye T
Bought by
Lewis Auto Sales Inc
Purchase Details
Closed on
Feb 1, 1972
Bought by
Yates Faye T
Create a Home Valuation Report for This Property
The Home Valuation Report is an in-depth analysis detailing your home's value as well as a comparison with similar homes in the area
Home Values in the Area
Average Home Value in this Area
Purchase History
| Date | Buyer | Sale Price | Title Company |
|---|---|---|---|
| Wncjre Llc | $125,000 | None Available | |
| Shellhaas Taylor C | $104,000 | Attorney | |
| Perry Janet A | $33,000 | -- | |
| Goodman Janie M | $11,000 | -- | |
| Chestnutt Peggy | $7,000 | -- | |
| Hunter Jimmy L Patricia S | $6,000 | -- | |
| Lewis Auto Sales Inc | -- | -- | |
| Yates Faye T | -- | -- |
Source: Public Records
Mortgage History
| Date | Status | Borrower | Loan Amount |
|---|---|---|---|
| Previous Owner | Shellhaas Taylor C | $102,116 |
Source: Public Records
Tax History Compared to Growth
Tax History
| Year | Tax Paid | Tax Assessment Tax Assessment Total Assessment is a certain percentage of the fair market value that is determined by local assessors to be the total taxable value of land and additions on the property. | Land | Improvement |
|---|---|---|---|---|
| 2023 | $1,024 | $120,500 | $41,900 | $78,600 |
| 2022 | $1,024 | $120,500 | $41,900 | $78,600 |
| 2021 | $1,372 | $160,300 | $41,900 | $118,400 |
| 2020 | $1,028 | $97,600 | $35,300 | $62,300 |
| 2019 | $1,028 | $97,600 | $35,300 | $62,300 |
| 2018 | $1,028 | $97,600 | $35,300 | $62,300 |
| 2017 | $1,028 | $97,600 | $35,300 | $62,300 |
| 2016 | $1,124 | $101,400 | $44,400 | $57,000 |
| 2015 | $1,074 | $101,400 | $44,400 | $57,000 |
| 2014 | $1,028 | $101,400 | $44,400 | $57,000 |
Source: Public Records
Map
Nearby Homes