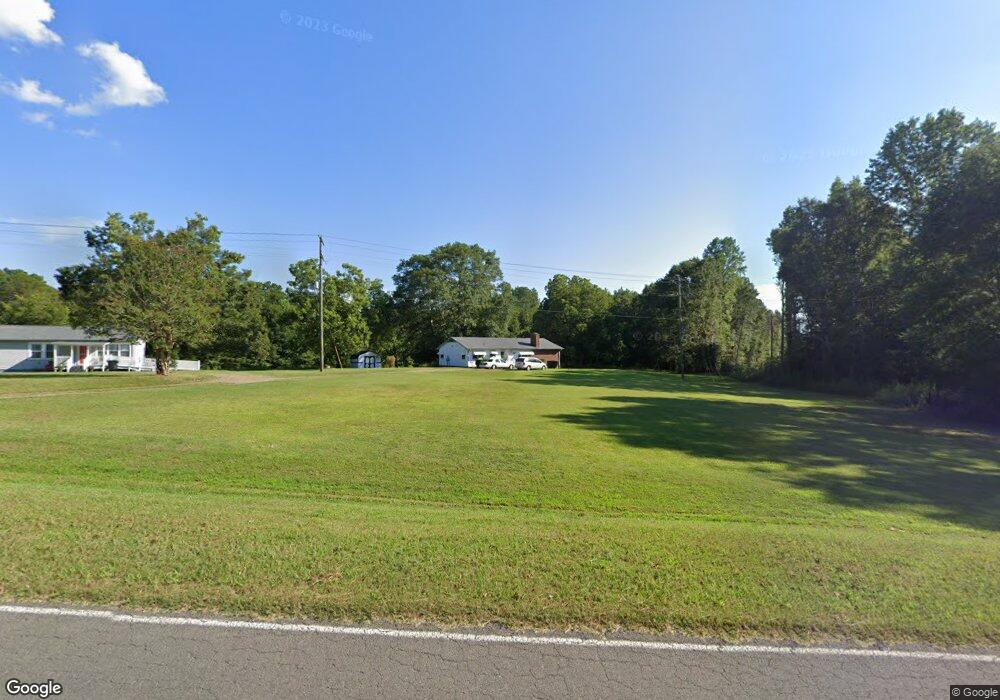
118 Mullinax Dr Grover, NC 28073
Estimated Value: $229,000 - $269,381
--
Bed
--
Bath
1,583
Sq Ft
$162/Sq Ft
Est. Value
About This Home
This home is located at 118 Mullinax Dr, Grover, NC 28073 and is currently estimated at $255,794, approximately $161 per square foot. 118 Mullinax Dr is a home located in Cleveland County with nearby schools including Grover Elementary School, Kings Mountain Middle, and Kings Mountain Intermediate School.
Create a Home Valuation Report for This Property
The Home Valuation Report is an in-depth analysis detailing your home's value as well as a comparison with similar homes in the area
Home Values in the Area
Average Home Value in this Area
Tax History Compared to Growth
Tax History
| Year | Tax Paid | Tax Assessment Tax Assessment Total Assessment is a certain percentage of the fair market value that is determined by local assessors to be the total taxable value of land and additions on the property. | Land | Improvement |
|---|---|---|---|---|
| 2025 | $1,445 | $227,509 | $117,201 | $110,308 |
| 2024 | $1,017 | $117,803 | $84,685 | $33,118 |
| 2023 | $1,012 | $117,803 | $84,685 | $33,118 |
| 2022 | $1,012 | $117,803 | $84,685 | $33,118 |
| 2021 | $1,015 | $117,803 | $84,685 | $33,118 |
| 2020 | $1,015 | $113,758 | $84,685 | $29,073 |
| 2019 | $1,015 | $113,758 | $84,685 | $29,073 |
| 2018 | $1,011 | $113,758 | $84,685 | $29,073 |
| 2017 | $1,006 | $113,758 | $84,685 | $29,073 |
| 2016 | $961 | $113,758 | $84,685 | $29,073 |
| 2015 | $1,156 | $138,453 | $77,039 | $61,414 |
| 2014 | $1,156 | $138,453 | $77,039 | $61,414 |
Source: Public Records
Map
Nearby Homes
- 203 Bethlehem Church Rd
- 00 Bethlehem Church Rd
- 132 Hicks Rd Unit 1
- 811 Cleveland Ave
- 101 Melvin Ct
- 111 Hicks Rd Unit 9
- 303 Hardin Cir
- 105 Elm Rd
- 308 M H Camp Hwy
- 219 Watterson Rd
- 101 Park Ln
- 210 Roy Bell Rd
- 129 Lakeview Dr
- 164 Blackburn Dr
- 764 S Battleground Ave
- 238 Lakeview Dr
- 00 Bunny Run
- 131 Sam Smith Dr
- 00 Mill Creek Rd
- 0 Pinewood Dr
- 120 Mullinax Dr
- 124 Mullinax Dr
- 123 Mullinax Dr
- 112 Mullinax Dr
- 125 Mullinax Dr
- 128 Mullinax Dr
- 127 Mullinax Dr
- 129 Mullinax Dr
- 130 Mullinax Dr
- 115 Yoda Dr
- 131 Mullinax Dr
- 117 Yoda Dr
- 113 Yoda Dr
- 132 Mullinax Dr
- 133 Mullinax Dr
- 116 Yoda Dr
- 109 Yoda Dr
- 1205 Bethlehem Church Rd
- 136 Mullinax Dr
- 135 Mullinax Dr