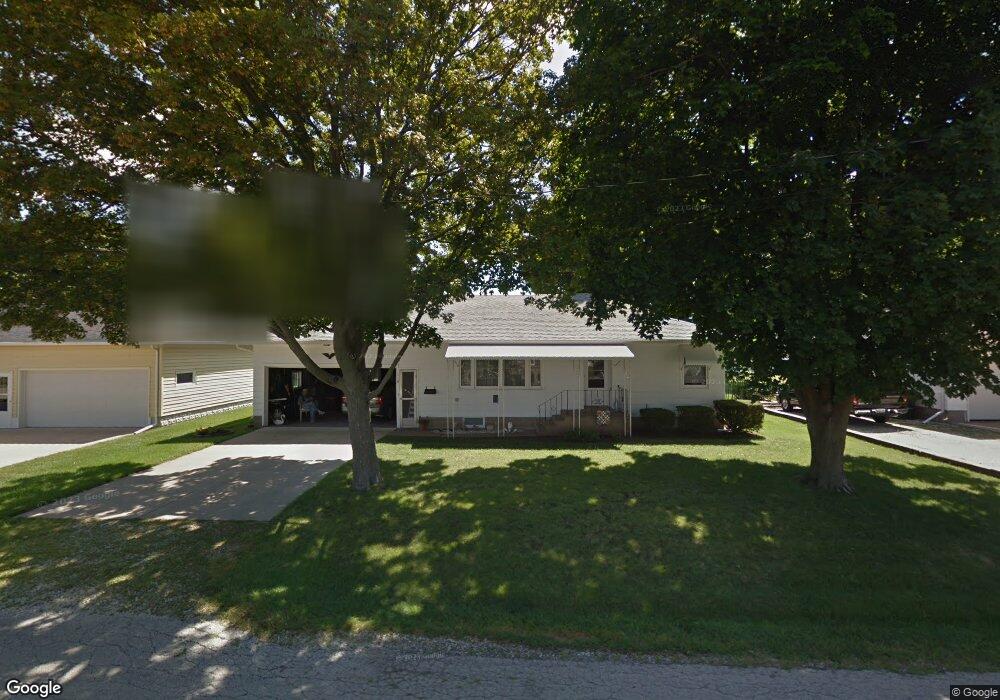
118 N Division St Geneseo, IL 61254
Estimated Value: $139,063 - $153,000
2
Beds
--
Bath
1,000
Sq Ft
$146/Sq Ft
Est. Value
About This Home
This home is located at 118 N Division St, Geneseo, IL 61254 and is currently estimated at $145,516, approximately $145 per square foot. 118 N Division St is a home located in Henry County with nearby schools including Geneseo High School and St. Malachy School.
Ownership History
Date
Name
Owned For
Owner Type
Purchase Details
Closed on
Feb 14, 2024
Sold by
Cathelyn Kenneth E
Bought by
Myers Bonnie J and Steffensmeier Laura C
Current Estimated Value
Home Financials for this Owner
Home Financials are based on the most recent Mortgage that was taken out on this home.
Original Mortgage
$128,250
Outstanding Balance
$125,992
Interest Rate
6.63%
Mortgage Type
New Conventional
Estimated Equity
$19,524
Purchase Details
Closed on
Jun 16, 2012
Sold by
Cathelyn Laura A
Bought by
Cathelyn Kenneth E and Cathelyn Lucille L
Purchase Details
Closed on
Jun 13, 2012
Sold by
Cathelyn Kenneth E and Cathelyn Lucille L
Bought by
Cathelyn Kenneth E and Cathelyn Lucille L
Purchase Details
Closed on
Jun 11, 2012
Sold by
Cathelyn Vernon K
Bought by
Cathelyn Kenneth E and Cathelyn Lucille L
Create a Home Valuation Report for This Property
The Home Valuation Report is an in-depth analysis detailing your home's value as well as a comparison with similar homes in the area
Home Values in the Area
Average Home Value in this Area
Purchase History
| Date | Buyer | Sale Price | Title Company |
|---|---|---|---|
| Myers Bonnie J | $135,000 | None Listed On Document | |
| Cathelyn Kenneth E | -- | None Available | |
| Cathelyn Kenneth E | -- | None Available | |
| Cathelyn Kenneth E | -- | None Available | |
| Cathelyn Kenneth E | -- | None Available | |
| Cathelyn Kenneth E | -- | None Available | |
| Cathelyn Kenneth E | -- | None Available |
Source: Public Records
Mortgage History
| Date | Status | Borrower | Loan Amount |
|---|---|---|---|
| Open | Myers Bonnie J | $128,250 |
Source: Public Records
Tax History Compared to Growth
Tax History
| Year | Tax Paid | Tax Assessment Tax Assessment Total Assessment is a certain percentage of the fair market value that is determined by local assessors to be the total taxable value of land and additions on the property. | Land | Improvement |
|---|---|---|---|---|
| 2024 | $3,256 | $43,948 | $4,059 | $39,889 |
| 2023 | $470 | $40,026 | $3,697 | $36,329 |
| 2022 | $481 | $37,199 | $3,436 | $33,763 |
| 2021 | $484 | $36,256 | $3,349 | $32,907 |
| 2020 | $477 | $36,593 | $3,380 | $33,213 |
| 2019 | $467 | $36,185 | $3,342 | $32,843 |
| 2018 | $469 | $34,202 | $3,159 | $31,043 |
| 2017 | $453 | $33,335 | $3,079 | $30,256 |
| 2016 | $485 | $32,490 | $3,001 | $29,489 |
| 2015 | $525 | $32,425 | $2,995 | $29,430 |
| 2013 | $525 | $31,817 | $2,938 | $28,879 |
Source: Public Records
Map
Nearby Homes
- 623 E Park St
- 549 E Park St
- 417 E Orange St
- 407 N Chicago St
- 513 E Pearl St
- 227 N State St
- 317 E South St
- 336 E Ogden Ave
- 522 N State St
- 608 S Oakwood Ave
- 19025 Bluff Rd
- 228 E Locust St
- 624 E Chestnut St
- 326 N Vail St
- 139 N Vail St
- 127 N Vail St
- 629 W Wells St
- 101 S Stewart St
- 909 S Spring St
- 513 W Elk St
- 126 N Division St
- 108 N Division St
- 612 E Orange St
- 130 N Division St
- 606 E Orange St
- 609 E Exchange St
- 125 N Division St
- 613 E Exchange St
- 618 E Orange St
- 119 N Division St
- 109 N Division St
- 601 E Exchange St
- 556 E Orange St
- 619 E Exchange St
- 554 E Orange St
- 554 E Orange St
- 557 E Exchange St
- 629 E Exchange St
- 548 E Orange St
- 624 E Orange St