Estimated Value: $190,000 - $234,000
3
Beds
2
Baths
1,866
Sq Ft
$116/Sq Ft
Est. Value
About This Home
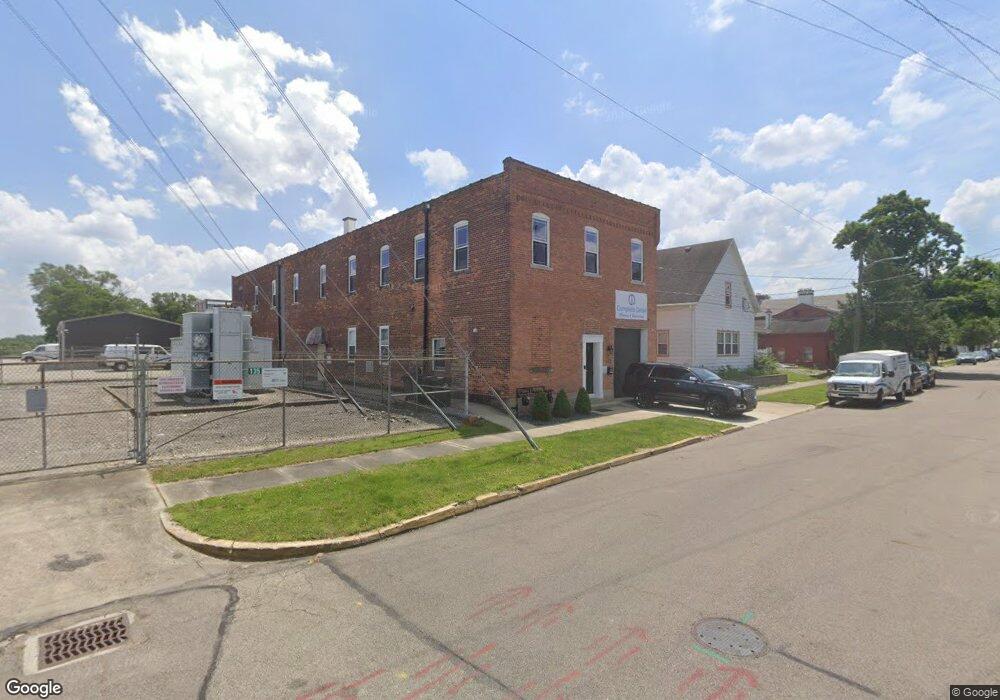
This home is located at 118 N Mulberry St, Troy, OH 45373 and is currently estimated at $217,134, approximately $116 per square foot. 118 N Mulberry St is a home located in Clark County with nearby schools including Northwestern Elementary School, Northwestern Junior/Senior High School, and Ridgewood School.
Ownership History
Date
Name
Owned For
Owner Type
Purchase Details
Closed on
Nov 28, 2023
Sold by
Gladman Malissa
Bought by
Baldwin Logan
Current Estimated Value
Home Financials for this Owner
Home Financials are based on the most recent Mortgage that was taken out on this home.
Original Mortgage
$198,341
Outstanding Balance
$195,228
Interest Rate
7.79%
Mortgage Type
FHA
Estimated Equity
$21,906
Purchase Details
Closed on
Oct 24, 2016
Sold by
Us Bank Trust Na
Bought by
Gladman Malissa
Purchase Details
Closed on
Apr 3, 2015
Sold by
Mowers Joseph A and Mowers Julia K
Bought by
Us Bank Trust Na and Lsf8 Master Participation Trusts
Purchase Details
Closed on
May 21, 1999
Sold by
Mulkey Judy E and Hall Judy E
Bought by
Mowers Joseph A and Mowers Julia K
Home Financials for this Owner
Home Financials are based on the most recent Mortgage that was taken out on this home.
Original Mortgage
$72,000
Interest Rate
6.92%
Mortgage Type
Purchase Money Mortgage
Create a Home Valuation Report for This Property
The Home Valuation Report is an in-depth analysis detailing your home's value as well as a comparison with similar homes in the area
Home Values in the Area
Average Home Value in this Area
Purchase History
| Date | Buyer | Sale Price | Title Company |
|---|---|---|---|
| Baldwin Logan | $202,000 | Sterling Land Title | |
| Baldwin Logan | $202,000 | Sterling Land Title | |
| Gladman Malissa | $17,200 | Ohio Real Estate Title | |
| Us Bank Trust Na | $33,400 | Attorney | |
| Mowers Joseph A | $90,000 | -- |
Source: Public Records
Mortgage History
| Date | Status | Borrower | Loan Amount |
|---|---|---|---|
| Open | Baldwin Logan | $198,341 | |
| Closed | Baldwin Logan | $198,341 | |
| Previous Owner | Mowers Joseph A | $72,000 |
Source: Public Records
Tax History Compared to Growth
Tax History
| Year | Tax Paid | Tax Assessment Tax Assessment Total Assessment is a certain percentage of the fair market value that is determined by local assessors to be the total taxable value of land and additions on the property. | Land | Improvement |
|---|---|---|---|---|
| 2024 | $1,490 | $34,630 | $13,820 | $20,810 |
| 2023 | $1,490 | $34,630 | $13,820 | $20,810 |
| 2022 | $1,534 | $34,630 | $13,820 | $20,810 |
| 2021 | $1,412 | $28,750 | $11,420 | $17,330 |
| 2020 | $1,397 | $28,750 | $11,420 | $17,330 |
| 2019 | $1,412 | $28,750 | $11,420 | $17,330 |
| 2018 | $1,335 | $26,950 | $11,420 | $15,530 |
| 2017 | $1,336 | $26,947 | $11,421 | $15,526 |
| 2016 | $1,354 | $27,164 | $11,550 | $15,614 |
| 2015 | $1,313 | $26,387 | $11,550 | $14,837 |
| 2014 | $878 | $26,387 | $11,550 | $14,837 |
| 2013 | $1,351 | $26,387 | $11,550 | $14,837 |
Source: Public Records
Map
Nearby Homes
- 30 Center St
- 6250 Willowdale Rd
- 4211 Grey Stone Crossing
- 4328 Pine Tree Place
- 3802 Lawrenceville Dr
- 593 Hiser Ave
- 5646 Springfield-Urbana Pike Unit Lot 88
- 5646 Springfield-Urbana Pike Unit Lot 122
- 5646 Springfield-Urbana Pike Unit Lot 61
- 5646 Springfield-Urbana Pike Unit Lot 127
- 5646 Springfield-Urbana Pike Unit Lot 72
- 794 Donnelly Ave
- 4100 Troy Rd Unit 96
- 4100 Troy Rd Unit 12
- 4514 Dowden St
- 880 Brendle Trace Unit 28
- 916 Sawmill Ct
- 26 Thomaston Trail
- 970 Forest Edge Ave
- 118 N Mulberry St
- 108 N Mulberry St
- 102 N Mulberry St
- 204 N Mulberry St
- 115 N Mulberry St
- 16 Center St
- 123 N Mulberry St
- 107 N Mulberry St
- 20 Center St
- 20 Center St
- 18 North St
- 319 Second
- 24 North St
- 214 N Mulberry St
- 98 N Mulberry St
- 207 N Mulberry St
- 31 North St
- 28 W North St
- 103 N Mulberry St
- 13 Church Hill Rd