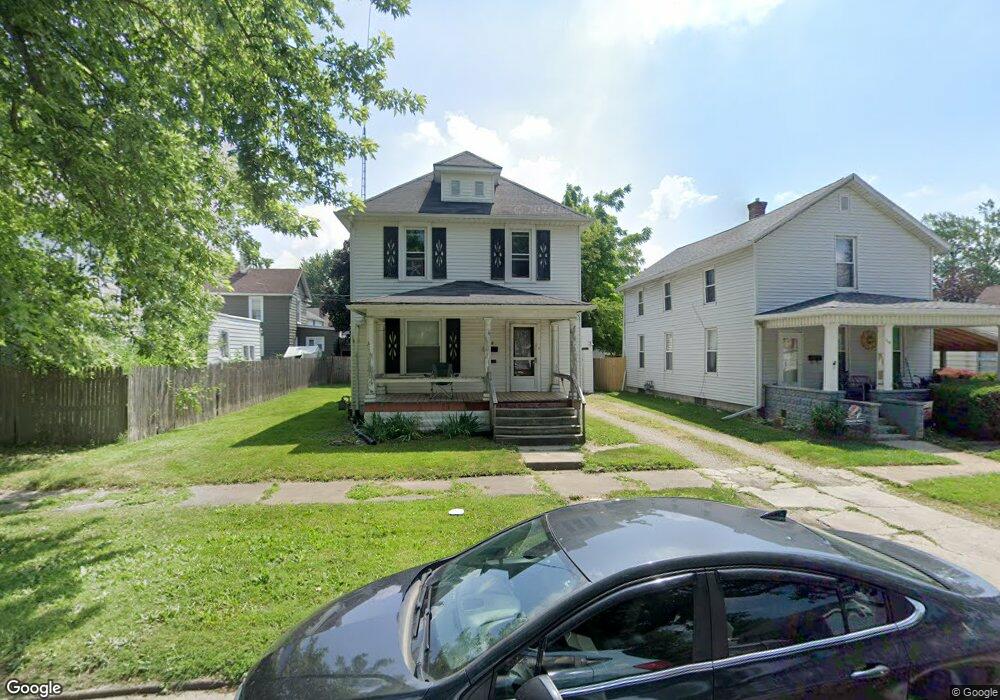
118 N Vine St Fostoria, OH 44830
Estimated Value: $123,000 - $139,000
3
Beds
2
Baths
1,408
Sq Ft
$92/Sq Ft
Est. Value
About This Home
This home is located at 118 N Vine St, Fostoria, OH 44830 and is currently estimated at $129,909, approximately $92 per square foot. 118 N Vine St is a home located in Hancock County with nearby schools including Fostoria Intermediate Elementary School and Fostoria Junior/Senior High School.
Ownership History
Date
Name
Owned For
Owner Type
Purchase Details
Closed on
Aug 28, 2006
Sold by
Westenbarger Sandra J
Bought by
Lamb Sherry E and Garner Donald R
Current Estimated Value
Home Financials for this Owner
Home Financials are based on the most recent Mortgage that was taken out on this home.
Original Mortgage
$74,000
Outstanding Balance
$44,946
Interest Rate
6.88%
Mortgage Type
Purchase Money Mortgage
Estimated Equity
$84,963
Purchase Details
Closed on
Jan 23, 2004
Sold by
Nowicki Joseph M and Nowicki Kim M
Bought by
Westenbarger Sandra J
Home Financials for this Owner
Home Financials are based on the most recent Mortgage that was taken out on this home.
Original Mortgage
$49,000
Interest Rate
5.91%
Mortgage Type
Purchase Money Mortgage
Purchase Details
Closed on
Sep 6, 1989
Bought by
Nowicki Joseph M and Nowicki Kim M
Create a Home Valuation Report for This Property
The Home Valuation Report is an in-depth analysis detailing your home's value as well as a comparison with similar homes in the area
Home Values in the Area
Average Home Value in this Area
Purchase History
| Date | Buyer | Sale Price | Title Company |
|---|---|---|---|
| Lamb Sherry E | $74,000 | Mid Am Title | |
| Westenbarger Sandra J | $59,000 | -- | |
| Nowicki Joseph M | $29,500 | -- |
Source: Public Records
Mortgage History
| Date | Status | Borrower | Loan Amount |
|---|---|---|---|
| Open | Lamb Sherry E | $74,000 | |
| Previous Owner | Westenbarger Sandra J | $49,000 |
Source: Public Records
Tax History Compared to Growth
Tax History
| Year | Tax Paid | Tax Assessment Tax Assessment Total Assessment is a certain percentage of the fair market value that is determined by local assessors to be the total taxable value of land and additions on the property. | Land | Improvement |
|---|---|---|---|---|
| 2024 | $1,481 | $29,760 | $2,660 | $27,100 |
| 2023 | $1,478 | $29,760 | $2,660 | $27,100 |
| 2022 | $1,610 | $29,760 | $2,660 | $27,100 |
| 2021 | $1,417 | $25,200 | $2,800 | $22,400 |
| 2020 | $1,423 | $25,200 | $2,800 | $22,400 |
| 2019 | $1,416 | $25,200 | $2,800 | $22,400 |
| 2018 | $1,264 | $21,910 | $2,430 | $19,480 |
| 2017 | $1,263 | $21,910 | $2,430 | $19,480 |
| 2016 | $1,110 | $21,910 | $2,430 | $19,480 |
| 2015 | $706 | $14,000 | $2,050 | $11,950 |
| 2014 | $706 | $14,000 | $2,050 | $11,950 |
| 2012 | $843 | $16,620 | $2,050 | $14,570 |
Source: Public Records
Map
Nearby Homes
- 509 College Ave
- 634 W Tiffin St
- 348 W South St
- 351 W South St
- 203 N Union St
- 603 N Vine St
- 520 N Union St
- 0 W South Route 12
- 723 N Union St
- 133 E South St
- 411 Monticello Dr
- 461 W Lytle St Unit 43
- 461 W Lytle St Unit 145
- 461 W Lytle St Unit 106
- 220 E High St
- 321 Mcdougal St
- 931 N Union St
- 892 N Countyline St
- 901 Central Ave
- 540 N Poplar St