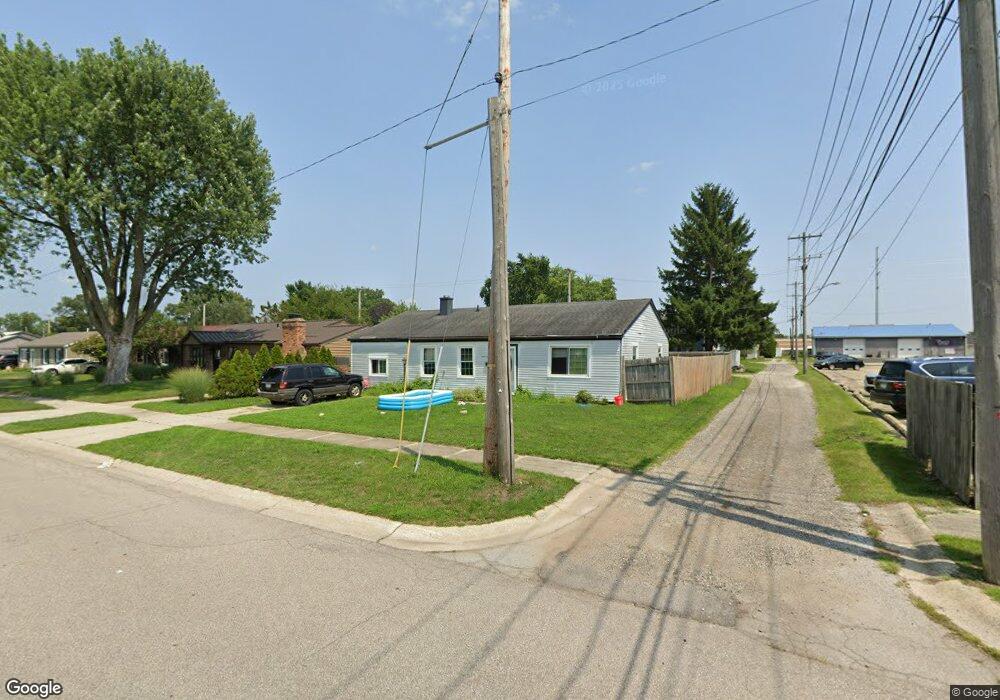
118 N Walnut St Mishawaka, IN 46544
Estimated Value: $104,000 - $179,957
3
Beds
1
Bath
1,288
Sq Ft
$111/Sq Ft
Est. Value
About This Home
This home is located at 118 N Walnut St, Mishawaka, IN 46544 and is currently estimated at $143,239, approximately $111 per square foot. 118 N Walnut St is a home located in St. Joseph County with nearby schools including Twin Branch Elementary School, John J. Young Middle School, and Mishawaka High School.
Ownership History
Date
Name
Owned For
Owner Type
Purchase Details
Closed on
Oct 26, 2015
Sold by
Wells Fargo Bank
Bought by
Klotz Richard D and Sharpe Robin S
Current Estimated Value
Purchase Details
Closed on
Jun 25, 2015
Sold by
St Joseph County Sheriff
Bought by
Wells Fargo Bank Na
Purchase Details
Closed on
Jun 10, 2010
Sold by
Wood Josh and Wood Sheena M
Bought by
Dodd Patrick R
Home Financials for this Owner
Home Financials are based on the most recent Mortgage that was taken out on this home.
Original Mortgage
$95,711
Interest Rate
5.75%
Mortgage Type
FHA
Purchase Details
Closed on
May 23, 2008
Sold by
Heckman Calvin
Bought by
Wood Josh and Wood Sheena
Home Financials for this Owner
Home Financials are based on the most recent Mortgage that was taken out on this home.
Original Mortgage
$84,163
Interest Rate
6.01%
Mortgage Type
FHA
Create a Home Valuation Report for This Property
The Home Valuation Report is an in-depth analysis detailing your home's value as well as a comparison with similar homes in the area
Home Values in the Area
Average Home Value in this Area
Purchase History
| Date | Buyer | Sale Price | Title Company |
|---|---|---|---|
| Klotz Richard D | $41,500 | Linear Title & Closing | |
| Wells Fargo Bank Na | $50,400 | -- | |
| Dodd Patrick R | -- | Lawyers Title | |
| Wood Josh | -- | Metropolitan Title In Llc |
Source: Public Records
Mortgage History
| Date | Status | Borrower | Loan Amount |
|---|---|---|---|
| Previous Owner | Dodd Patrick R | $95,711 | |
| Previous Owner | Wood Josh | $84,163 |
Source: Public Records
Tax History Compared to Growth
Tax History
| Year | Tax Paid | Tax Assessment Tax Assessment Total Assessment is a certain percentage of the fair market value that is determined by local assessors to be the total taxable value of land and additions on the property. | Land | Improvement |
|---|---|---|---|---|
| 2024 | $4,633 | $97,300 | $19,100 | $78,200 |
| 2023 | $1,698 | $72,400 | $9,700 | $62,700 |
| 2022 | $1,698 | $72,400 | $9,700 | $62,700 |
| 2021 | $1,639 | $69,500 | $10,700 | $58,800 |
| 2020 | $1,426 | $60,300 | $11,000 | $49,300 |
| 2019 | $1,340 | $56,400 | $10,300 | $46,100 |
| 2018 | $1,639 | $55,200 | $9,900 | $45,300 |
| 2017 | $1,730 | $54,000 | $9,900 | $44,100 |
| 2016 | $1,653 | $54,000 | $9,900 | $44,100 |
| 2014 | $2,044 | $75,600 | $8,600 | $67,000 |
| 2013 | $726 | $75,600 | $8,600 | $67,000 |
Source: Public Records
Map
Nearby Homes
- 4207 Lincolnway E
- 507 N Oakland Ave
- 12340 Lincoln Way E
- 135 Ray St
- 4326 Cassell Ave
- 3751 Terry Ln
- 3623 Vistula Rd
- 318 Terry Ln
- 123 Oakside Ave
- 4607 Rivers Edge Dr
- 3820 Cottage Ave
- 5116 Bankside Ct
- 705 Vistula Terrace Unit 1
- 514 Ventura Dr
- 11908 Franklin St
- 57074 Guernsey Ave
- 57047 Greenlawn Ave
- 624 Windy Cove Ct
- 157 Manor Dr
- 11896 Vistula Rd
- 122 N Walnut St
- 128 N Walnut St
- 109 Wabash Ave
- 115 Wabash Ave
- 113 N Walnut St
- 134 N Walnut St
- 119 N Walnut St
- 121 Wabash Ave
- 202 N Walnut St
- 125 Wabash Ave
- 135 N Walnut St
- 118 N Oakland Ave
- 115 N Walnut St
- 108 Wabash Ave
- 4305 Lincolnway E
- 114 Wabash Ave
- 208 N Walnut St
- 201 Wabash Ave
- 4313 Lincolnway E
- 102 N Walnut St