Estimated Value: $339,844 - $342,000
4
Beds
3
Baths
2,359
Sq Ft
$144/Sq Ft
Est. Value
About This Home
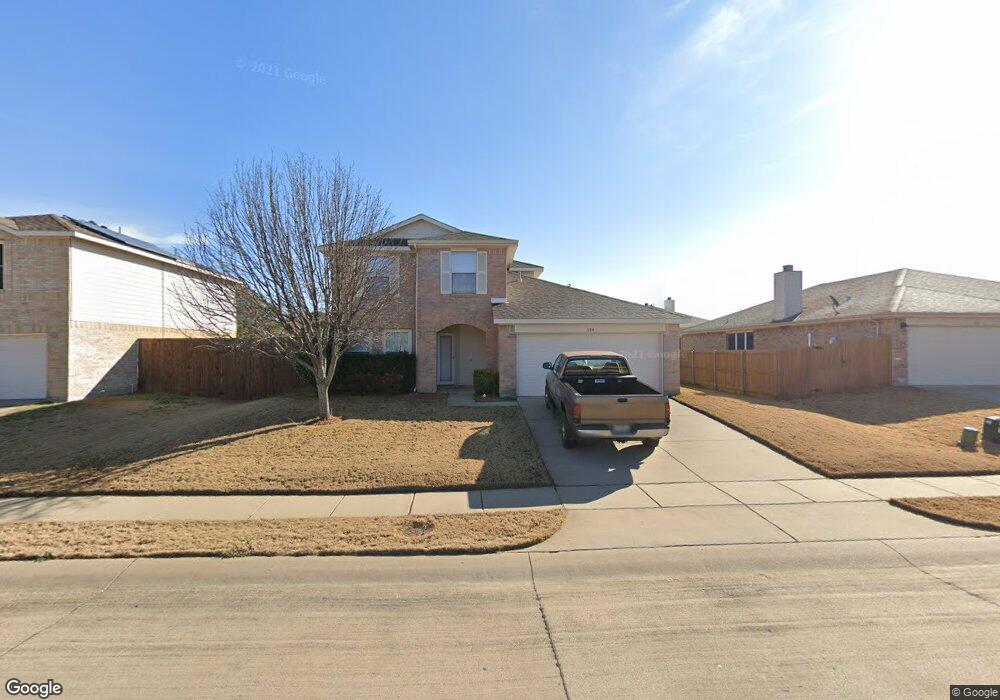
This home is located at 118 Nighthawk Dr, Krum, TX 76249 and is currently estimated at $340,711, approximately $144 per square foot. 118 Nighthawk Dr is a home located in Denton County with nearby schools including Krum Early Education Center, Blanche Dodd Intermediate School, and Krum Middle School.
Ownership History
Date
Name
Owned For
Owner Type
Purchase Details
Closed on
Jul 7, 2017
Sold by
Hibert Enterprises Llc
Bought by
Hanlon Joseph F
Current Estimated Value
Home Financials for this Owner
Home Financials are based on the most recent Mortgage that was taken out on this home.
Original Mortgage
$150,000
Outstanding Balance
$124,830
Interest Rate
3.95%
Mortgage Type
New Conventional
Estimated Equity
$215,881
Purchase Details
Closed on
Feb 28, 2016
Sold by
Smokin S Propeties Llc
Bought by
Hibert Enterprises Llc
Purchase Details
Closed on
Nov 25, 2002
Sold by
Rh Of Texas Ltd Partnership
Bought by
Sullivan Jason and Sullivan Dana
Home Financials for this Owner
Home Financials are based on the most recent Mortgage that was taken out on this home.
Original Mortgage
$142,759
Interest Rate
6.28%
Mortgage Type
FHA
Create a Home Valuation Report for This Property
The Home Valuation Report is an in-depth analysis detailing your home's value as well as a comparison with similar homes in the area
Home Values in the Area
Average Home Value in this Area
Purchase History
| Date | Buyer | Sale Price | Title Company |
|---|---|---|---|
| Hanlon Joseph F | -- | Freedom Title | |
| Hibert Enterprises Llc | -- | None Available | |
| Smokin S Properties Llc | -- | None Available | |
| Sullivan Jason | -- | -- |
Source: Public Records
Mortgage History
| Date | Status | Borrower | Loan Amount |
|---|---|---|---|
| Open | Hanlon Joseph F | $150,000 | |
| Previous Owner | Sullivan Jason | $142,759 |
Source: Public Records
Tax History Compared to Growth
Tax History
| Year | Tax Paid | Tax Assessment Tax Assessment Total Assessment is a certain percentage of the fair market value that is determined by local assessors to be the total taxable value of land and additions on the property. | Land | Improvement |
|---|---|---|---|---|
| 2025 | $2,407 | $343,093 | $67,860 | $275,233 |
| 2024 | $7,115 | $353,065 | $0 | $0 |
| 2023 | $2,215 | $320,968 | $67,860 | $321,743 |
| 2022 | $6,693 | $291,789 | $67,860 | $243,819 |
| 2021 | $5,882 | $265,263 | $49,010 | $216,253 |
| 2020 | $5,520 | $243,732 | $40,716 | $203,016 |
| 2019 | $5,791 | $239,999 | $40,716 | $201,695 |
| 2018 | $5,292 | $218,181 | $40,716 | $177,465 |
| 2017 | $4,657 | $191,173 | $40,716 | $150,457 |
| 2016 | $4,637 | $176,464 | $24,882 | $156,454 |
| 2015 | $3,378 | $160,422 | $24,882 | $135,540 |
| 2013 | -- | $144,673 | $24,882 | $119,791 |
Source: Public Records
Map
Nearby Homes
- 1304 Dakota Trail
- 1404 Wenatchee Dr
- 0 Farm To Market Road 1173
- 205 Broken Arrow
- 1604 Withers Way
- 101 Thoroughbred Dr
- TBD E Mccart St
- 1623 Withers Way
- 334 Saddlebrook Dr
- 3454 Eloise Ln
- 1620 Kawati Way
- 1627 Kawati Way
- 905 Clearview St
- 3537 Camden Creek Rd
- TBD Masch Branch Rd
- 328 Broken Bow
- 1536 Wagon Wheel Way
- 2309 Hillview Dr
- 4574 Masch Branch Rd
- 1500 Radecke Rd
- 116 Nighthawk Dr
- 120 Nighthawk Dr
- 117 Comanche Trail
- 114 Nighthawk Dr
- 115 Comanche Trail
- 119 Comanche Trail
- 1311 Sequoia Dr
- 113 Comanche Trail
- 113 Nighthawk Dr
- 112 Nighthawk Dr
- 1404 Sequoia Dr
- 203 Comanche Trail
- 111 Comanche Trail
- 1309 Sequoia Dr
- 111 Nighthawk Dr
- 1312 Sequoia Dr
- 1310 Sequoia Dr
- 118 Comanche Trail
- 109 Comanche Trail
- 116 Comanche Trail