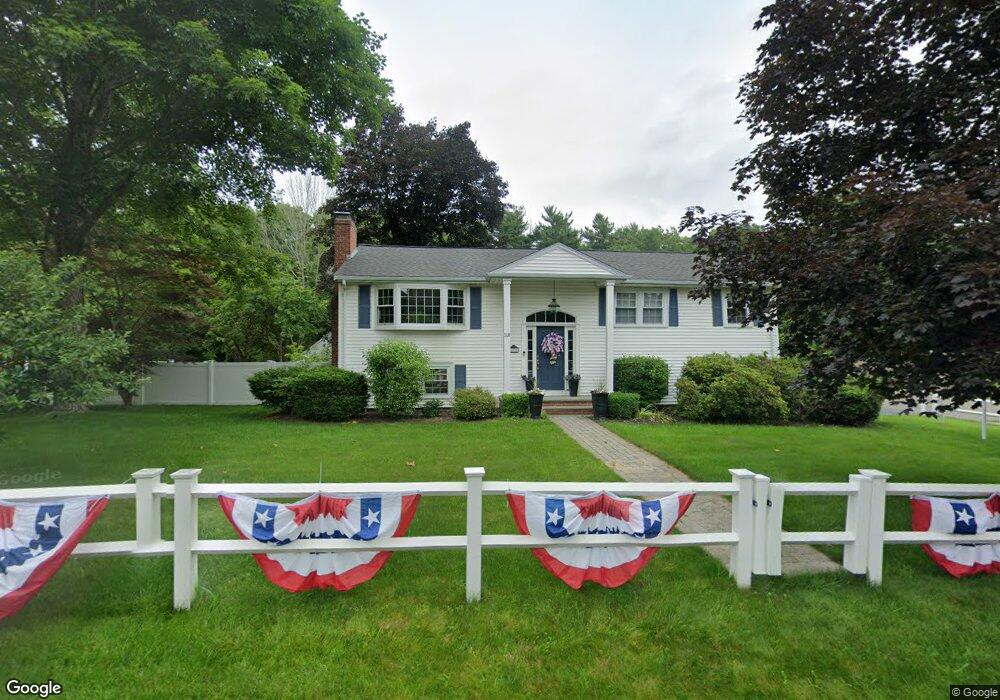
118 North St Walpole, MA 02081
Estimated Value: $649,416 - $828,000
4
Beds
2
Baths
1,344
Sq Ft
$546/Sq Ft
Est. Value
About This Home
This home is located at 118 North St, Walpole, MA 02081 and is currently estimated at $733,854, approximately $546 per square foot. 118 North St is a home located in Norfolk County with nearby schools including Fisher School, Walpole Middle School, and Walpole High School.
Ownership History
Date
Name
Owned For
Owner Type
Purchase Details
Closed on
Dec 8, 2023
Sold by
Carter Karen E
Bought by
Carter Karen E and Johnson Stephen C
Current Estimated Value
Purchase Details
Closed on
Jun 4, 1998
Sold by
Gill John and Gill Janet M
Bought by
Carter John T and Carter Mary E
Home Financials for this Owner
Home Financials are based on the most recent Mortgage that was taken out on this home.
Original Mortgage
$50,000
Interest Rate
7.05%
Mortgage Type
Purchase Money Mortgage
Purchase Details
Closed on
Oct 31, 1996
Sold by
Hunter Re James
Bought by
Gill John and Gill Janet M
Home Financials for this Owner
Home Financials are based on the most recent Mortgage that was taken out on this home.
Original Mortgage
$155,000
Interest Rate
8.07%
Mortgage Type
Purchase Money Mortgage
Create a Home Valuation Report for This Property
The Home Valuation Report is an in-depth analysis detailing your home's value as well as a comparison with similar homes in the area
Home Values in the Area
Average Home Value in this Area
Purchase History
| Date | Buyer | Sale Price | Title Company |
|---|---|---|---|
| Carter Karen E | -- | None Available | |
| Carter John T | $245,000 | -- | |
| Gill John | $230,000 | -- | |
| Gill John | $230,000 | -- |
Source: Public Records
Mortgage History
| Date | Status | Borrower | Loan Amount |
|---|---|---|---|
| Previous Owner | Carter John T | $50,000 | |
| Previous Owner | Gill John | $155,000 | |
| Previous Owner | Gill John | $155,000 |
Source: Public Records
Tax History Compared to Growth
Tax History
| Year | Tax Paid | Tax Assessment Tax Assessment Total Assessment is a certain percentage of the fair market value that is determined by local assessors to be the total taxable value of land and additions on the property. | Land | Improvement |
|---|---|---|---|---|
| 2025 | $8,024 | $625,400 | $349,500 | $275,900 |
| 2024 | $7,847 | $593,600 | $336,000 | $257,600 |
| 2023 | $7,455 | $536,700 | $292,200 | $244,500 |
| 2022 | $7,049 | $487,500 | $270,600 | $216,900 |
| 2021 | $6,783 | $457,100 | $255,300 | $201,800 |
| 2020 | $6,692 | $446,400 | $240,800 | $205,600 |
| 2019 | $6,455 | $427,500 | $231,700 | $195,800 |
| 2018 | $6,155 | $403,100 | $223,200 | $179,900 |
| 2017 | $5,950 | $388,100 | $214,600 | $173,500 |
| 2016 | $5,787 | $371,900 | $206,300 | $165,600 |
| 2015 | $5,553 | $353,700 | $196,400 | $157,300 |
| 2014 | $5,239 | $332,400 | $196,400 | $136,000 |
Source: Public Records
Map
Nearby Homes
- 41 Gill St Unit A
- 246 Pemberton St
- 881 Main St Unit 9
- 260 Elm St
- 19 and 23 Arlington Ln
- 8 Rainbow Pond Dr Unit 8
- 2 Alexandra Way
- 486 Washington St
- 26 Dover Dr
- 145 South St Unit 5
- 127 Clear Pond Dr
- 137 Clear Pond Dr
- 12 Timberline Dr Unit 28
- 115 High St
- 17 Bridle Path
- 26 Arcadia Rd
- 74 Granite St
- 1391 Main St Unit 308
- 1391 Main St Unit 306
- 1391 Main St Unit 304