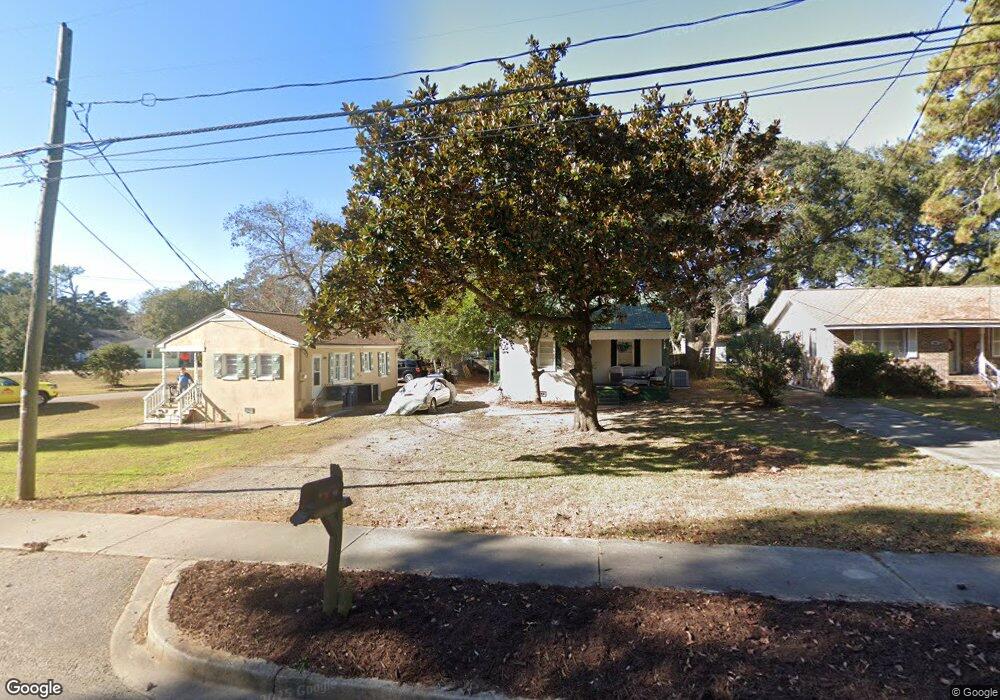
118 Oak St Unit 2 Myrtle Beach, SC 29577
Estimated Value: $271,354 - $383,000
2
Beds
2
Baths
915
Sq Ft
$354/Sq Ft
Est. Value
About This Home
This home is located at 118 Oak St Unit 2, Myrtle Beach, SC 29577 and is currently estimated at $323,589, approximately $353 per square foot. 118 Oak St Unit 2 is a home located in Horry County with nearby schools including Seaside Elementary, St. James Intermediate, and St. James Middle School.
Ownership History
Date
Name
Owned For
Owner Type
Purchase Details
Closed on
Dec 9, 2020
Sold by
Ryll Mark
Bought by
Jamerson Dennis B and Jamerson Tammy F
Current Estimated Value
Purchase Details
Closed on
Dec 6, 2017
Sold by
Biryla Kenneth James
Bought by
Ryll Mark and Ryll Gretchen
Purchase Details
Closed on
Mar 29, 2016
Sold by
Mathews Robert Z
Bought by
Biryla Kenneth J
Home Financials for this Owner
Home Financials are based on the most recent Mortgage that was taken out on this home.
Original Mortgage
$112,000
Interest Rate
3.64%
Mortgage Type
New Conventional
Purchase Details
Closed on
Jul 13, 2012
Sold by
Sutton Winfred E
Bought by
Mathews Robert Z
Purchase Details
Closed on
Dec 30, 2003
Sold by
Hester Kimberly C
Bought by
Sutton Winfred E
Purchase Details
Closed on
Feb 29, 2000
Sold by
Griggs Raleigh and Griggs Beverly
Bought by
Hester Kimberly C
Create a Home Valuation Report for This Property
The Home Valuation Report is an in-depth analysis detailing your home's value as well as a comparison with similar homes in the area
Home Values in the Area
Average Home Value in this Area
Purchase History
| Date | Buyer | Sale Price | Title Company |
|---|---|---|---|
| Jamerson Dennis B | $195,000 | -- | |
| Ryll Mark | $159,000 | -- | |
| Biryla Kenneth J | $145,000 | -- | |
| Mathews Robert Z | $86,900 | -- | |
| Sutton Winfred E | $93,900 | -- | |
| Hester Kimberly C | $80,000 | -- | |
| Griggs Raleigh | $24,816 | -- |
Source: Public Records
Mortgage History
| Date | Status | Borrower | Loan Amount |
|---|---|---|---|
| Previous Owner | Biryla Kenneth J | $112,000 |
Source: Public Records
Tax History Compared to Growth
Tax History
| Year | Tax Paid | Tax Assessment Tax Assessment Total Assessment is a certain percentage of the fair market value that is determined by local assessors to be the total taxable value of land and additions on the property. | Land | Improvement |
|---|---|---|---|---|
| 2024 | $2,611 | $12,000 | $0 | $12,000 |
| 2023 | $2,611 | $19,950 | $0 | $19,950 |
| 2021 | $2,598 | $19,950 | $0 | $19,950 |
| 2020 | $2,077 | $16,065 | $0 | $16,065 |
| 2019 | $2,077 | $16,065 | $0 | $16,065 |
| 2018 | $2,155 | $16,275 | $0 | $16,275 |
| 2017 | $608 | $8,400 | $0 | $8,400 |
| 2016 | -- | $8,040 | $0 | $8,040 |
| 2015 | $1,374 | $14,070 | $0 | $14,070 |
| 2014 | $1,331 | $8,040 | $0 | $8,040 |
Source: Public Records
Map
Nearby Homes
- 215-B S Dogwood Dr
- 112 3rd Ave S Unit B
- 419 Ocean Palms Dr
- 210 S Ocean Blvd Unit 101
- 17 S Oak Dr
- 327A Lakeside Dr
- 311 Surfside Dr
- 411A S Ocean Blvd
- 412 Cypress Dr
- 115 6th Ave S
- 22 N Ocean Blvd
- 710 Lakeside Dr
- 121B 7th Ave S Unit 1B
- 712 Dogwood Dr S Unit 101
- 114 N Pinewood Dr
- 617 Surfside Dr
- 712A S Ocean Blvd
- 114 8th Ave S Unit Left Side
- 114 8th Ave S Unit Right Side
- TBD Maple Dr
- 118 S Oak Dr Unit 3 Willow Winds
- 118 S Oak Dr Unit 3
- 118 S Oak Dr Unit 2
- 118 S Oak Dr
- 118 S Oak Dr Unit 6 Willow Winds
- 118 S Oak Dr Unit 1
- 118 S Oak Dr Unit 5
- 118 S Oak Dr Unit 6
- 118 S Oak Dr Unit 4
- 118 S Oak Dr Unit 118 S. Oak Dr. Unit
- 118 S Oak Dr Unit WILLOW WINDS UNIT 4
- 118 S Oak Dr Unit 3
- 118 S Oak St
- 166B S Oak Dr
- 114 S Oak Dr
- 120 S Pinewood Dr
- 118 S Pinewood Dr Unit No Shoes, No Shirt,
- 118B S Pinewood Dr Unit SB
- 408 3rd Ave S Unit SB
- 116 S Pinewood Dr