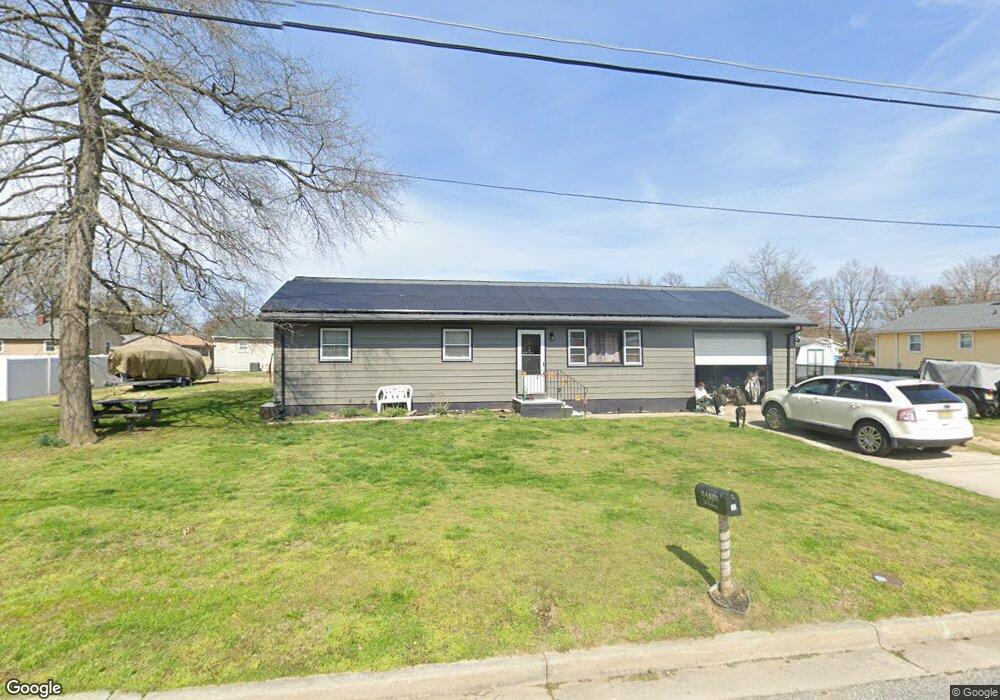
118 Oberlin Rd Pennsville, NJ 08070
Estimated Value: $215,000 - $258,000
--
Bed
--
Bath
1,176
Sq Ft
$209/Sq Ft
Est. Value
About This Home
This home is located at 118 Oberlin Rd, Pennsville, NJ 08070 and is currently estimated at $245,926, approximately $209 per square foot. 118 Oberlin Rd is a home located in Salem County with nearby schools including Valley Park Elementary School, Penn Beach Elementary School, and Central Park Elementary School.
Ownership History
Date
Name
Owned For
Owner Type
Purchase Details
Closed on
Jun 6, 2022
Sold by
Baker Dennis J and Baker Noreen
Bought by
Baker Justin Aaron
Current Estimated Value
Purchase Details
Closed on
Feb 29, 2008
Sold by
Biernacki John A and Biernacki Susan A
Bought by
Baker Dennis J and Baker Noreen
Purchase Details
Closed on
Feb 1, 2006
Sold by
Biernacki John A and Biernacki Susan A
Bought by
Shore Management Co Delaware Valley Inc
Purchase Details
Closed on
Mar 8, 2000
Sold by
Biernacki John A
Bought by
Biernacki John A and Biernacki Susan A
Purchase Details
Closed on
Jul 24, 1998
Sold by
Springer Joseph E and Springer Mary Ann
Bought by
Biernacki John A
Home Financials for this Owner
Home Financials are based on the most recent Mortgage that was taken out on this home.
Original Mortgage
$90,746
Interest Rate
6.99%
Mortgage Type
FHA
Create a Home Valuation Report for This Property
The Home Valuation Report is an in-depth analysis detailing your home's value as well as a comparison with similar homes in the area
Home Values in the Area
Average Home Value in this Area
Purchase History
| Date | Buyer | Sale Price | Title Company |
|---|---|---|---|
| Baker Justin Aaron | -- | None Listed On Document | |
| Baker Dennis J | $120,000 | -- | |
| Shore Management Co Delaware Valley Inc | $103,050 | First Financial Title Agency | |
| Biernacki John A | -- | -- | |
| Biernacki John A | $92,000 | Intercoastal Title Agency In |
Source: Public Records
Mortgage History
| Date | Status | Borrower | Loan Amount |
|---|---|---|---|
| Previous Owner | Biernacki John A | $90,746 |
Source: Public Records
Tax History Compared to Growth
Tax History
| Year | Tax Paid | Tax Assessment Tax Assessment Total Assessment is a certain percentage of the fair market value that is determined by local assessors to be the total taxable value of land and additions on the property. | Land | Improvement |
|---|---|---|---|---|
| 2025 | $6,887 | $135,100 | $50,200 | $84,900 |
| 2024 | $6,631 | $135,100 | $50,200 | $84,900 |
| 2023 | $6,631 | $135,100 | $50,200 | $84,900 |
| 2022 | $6,423 | $135,100 | $50,200 | $84,900 |
| 2021 | $6,246 | $135,100 | $50,200 | $84,900 |
| 2020 | $6,057 | $135,100 | $50,200 | $84,900 |
| 2019 | $5,757 | $135,100 | $50,200 | $84,900 |
| 2018 | $5,550 | $135,100 | $50,200 | $84,900 |
| 2017 | $5,354 | $135,100 | $50,200 | $84,900 |
| 2016 | $4,927 | $135,100 | $50,200 | $84,900 |
| 2015 | $4,701 | $135,100 | $50,200 | $84,900 |
| 2014 | $4,576 | $135,100 | $50,200 | $84,900 |
Source: Public Records
Map
Nearby Homes
- 123 Nottingham Rd
- 141 Delaware Dr
- 122 Oberlin Rd
- 119 Oberlin Rd
- 119 Nottingham Rd
- 125 Nottingham Rd
- 121 Oberlin Rd
- 145 Delaware Dr
- 127 Nottingham Rd
- 125 Oberlin Rd
- 126 Oberlin Rd
- 118 Princeton Rd
- 142 Delaware Dr
- 122 Princeton Rd
- 122 Nottingham Rd
- 122 Nottingham Rd
- 147 Delaware Dr
- 117 Nottingham Rd
- 129 Nottingham Rd
- 144 Delaware Dr