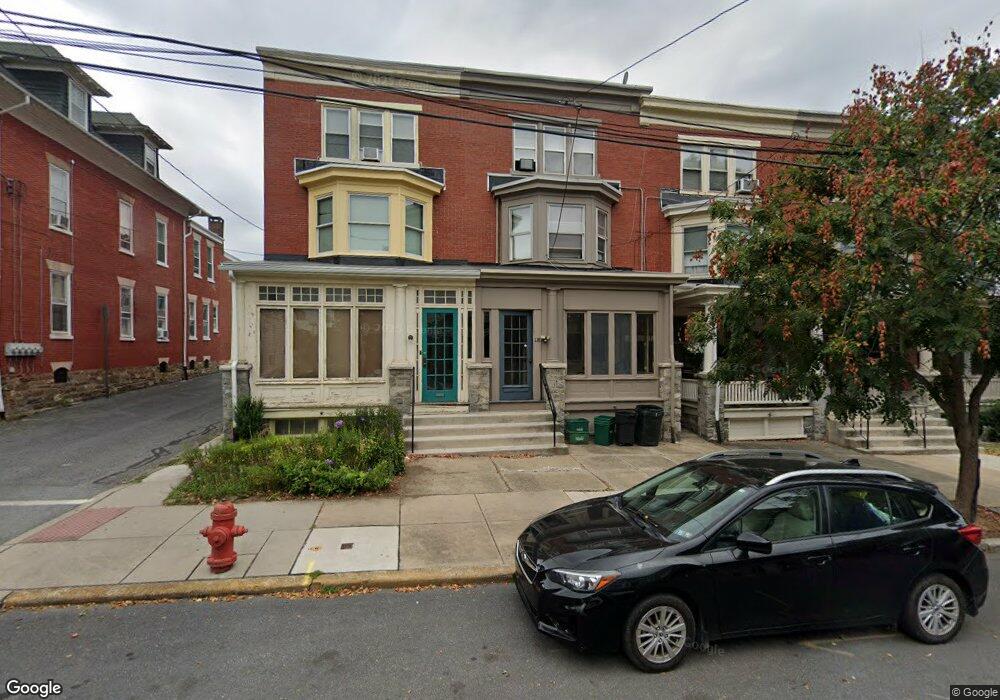
118 Ruby St Lancaster, PA 17603
West End NeighborhoodEstimated Value: $230,000 - $383,000
3
Beds
3
Baths
2,080
Sq Ft
$149/Sq Ft
Est. Value
About This Home
This home is located at 118 Ruby St, Lancaster, PA 17603 and is currently estimated at $310,901, approximately $149 per square foot. 118 Ruby St is a home located in Lancaster County with nearby schools including Smith-Wade-El Elementary School, Wheatland Middle School, and McCaskey High School.
Ownership History
Date
Name
Owned For
Owner Type
Purchase Details
Closed on
Feb 28, 2007
Sold by
Weidman Jeffrey S
Bought by
Weidman Jeffrey S and Weidman Sharmaine L
Current Estimated Value
Home Financials for this Owner
Home Financials are based on the most recent Mortgage that was taken out on this home.
Original Mortgage
$50,000
Interest Rate
6.27%
Mortgage Type
Credit Line Revolving
Create a Home Valuation Report for This Property
The Home Valuation Report is an in-depth analysis detailing your home's value as well as a comparison with similar homes in the area
Home Values in the Area
Average Home Value in this Area
Purchase History
| Date | Buyer | Sale Price | Title Company |
|---|---|---|---|
| Weidman Jeffrey S | -- | None Available |
Source: Public Records
Mortgage History
| Date | Status | Borrower | Loan Amount |
|---|---|---|---|
| Closed | Weidman Jeffrey S | $50,000 |
Source: Public Records
Tax History
| Year | Tax Paid | Tax Assessment Tax Assessment Total Assessment is a certain percentage of the fair market value that is determined by local assessors to be the total taxable value of land and additions on the property. | Land | Improvement |
|---|---|---|---|---|
| 2025 | $4,954 | $125,200 | $23,800 | $101,400 |
| 2024 | $4,954 | $125,200 | $23,800 | $101,400 |
| 2023 | $4,871 | $125,200 | $23,800 | $101,400 |
| 2022 | $4,668 | $125,200 | $23,800 | $101,400 |
| 2021 | $4,568 | $125,200 | $23,800 | $101,400 |
| 2020 | $4,568 | $125,200 | $23,800 | $101,400 |
| 2019 | $4,499 | $125,200 | $23,800 | $101,400 |
| 2018 | $2,670 | $125,200 | $23,800 | $101,400 |
| 2017 | $3,748 | $81,600 | $14,200 | $67,400 |
| 2016 | $3,714 | $81,600 | $14,200 | $67,400 |
| 2015 | $1,449 | $81,600 | $14,200 | $67,400 |
| 2014 | $3,241 | $81,600 | $14,200 | $67,400 |
Source: Public Records
Map
Nearby Homes
Your Personal Tour Guide
Ask me questions while you tour the home.